
Image
|
Figure Caption
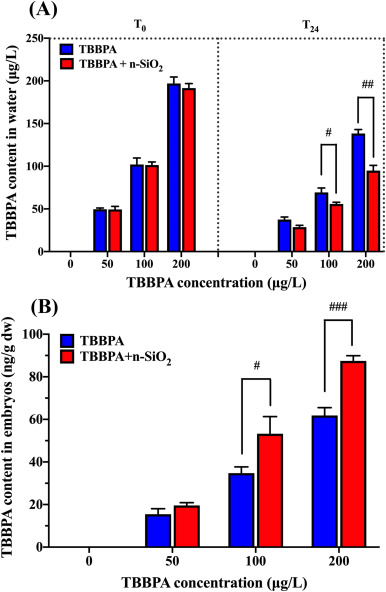
Fig. 1 Fig. 1. Measured concentrations of TBBPA in (A) exposure solutions and (B) larvae. Data are shown as mean ± SEM of three replicate samples. Water was sampled just after (T0) and before renewal (T24). TBBPA contents in the control were below the LOD. #P < 0.05, ##P < 0.01, and ###P < 0.001 indicates significant difference between TBBPA single exposure groups and their corresponding co-exposure groups with n-SiO2.
Acknowledgments
This image is the copyrighted work of the attributed author or publisher, and
ZFIN has permission only to display this image to its users.
Additional permissions should be obtained from the applicable author or publisher of the image.
Full text @ Ecotoxicol. Environ. Saf.