
Image
|
Figure Caption
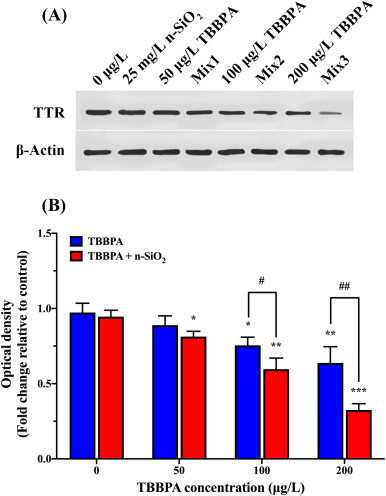
Fig. 4 Fig. 4. Western blot analyses of TTR protein levels in larvae after exposure to TBBPA (0, 50, 100, and 200 μg/L) alone or in combination with n-SiO2 (25 mg/L) for 120 h. (A) Representative Western blots of TTR; (B) Quantification of the relative repression of TTR. Results are expressed as mean ± SEM of three replicate samples. *P < 0.05, **P < 0.01, and***P < 0.001 indicates significant differences between exposure groups and the control group, and #P < 0.05, ##P < 0.01 represents significant differences between TBBPA groups and their corresponding co-exposure groups with n-SiO2.
Acknowledgments
This image is the copyrighted work of the attributed author or publisher, and
ZFIN has permission only to display this image to its users.
Additional permissions should be obtained from the applicable author or publisher of the image.
Full text @ Ecotoxicol. Environ. Saf.