FIGURE SUMMARY
Title

Phorbol 12-Myristate 13-Acetate Induced Toxicity Study and the Role of Tangeretin in Abrogating HIF-1α-NF-κB Crosstalk In Vitro and In Vivo

Authors
Chang, S.N., Dey, D.K., Oh, S.T., Kong, W.H., Cho, K.H., Al-Olayan, E.M., Hwang, B.S., Kang, S.C., Park, J.G.
Source
Full text @ Int. J. Mol. Sci.

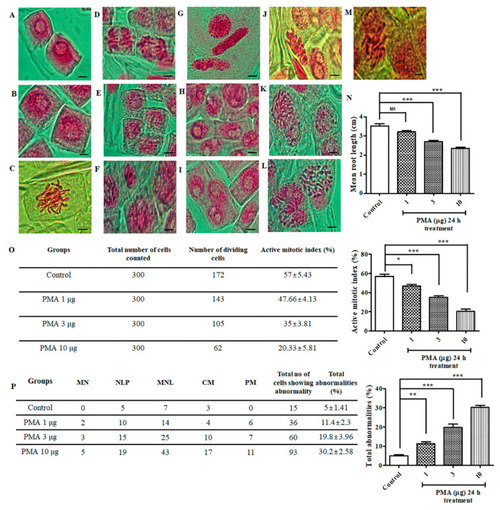
Chromosomal aberrations induced by phorbol 12-myristate 13-acetate (PMA) in the root tip meristem of Allium cepa. Acetocarmine stain was used for staining the root tips to observe the different stages of mitosis. (AE) Normal stages of mitosis in onion root tip: (A) Interphase, (B) Prophase, (C) Metaphase, (D) Anaphase, (E) Telophase. Different aberrations were observed after PMA (0.1 μg, 1 μg, 10 μg) treatment for 24 h. (F) Micronucleus, (G) Loculated nucleus, (H) Nuclear lesion, (I) Multi-nucleated cell lesion, (J) C-metaphase, (K) Polyploidy and chromosomal bridge, (L) Laggard metaphase and anaphase, (M) Pulverized metaphase, (N) Mean root length of A. cepa, (O) Percentage of mitotic index, (P) Chromosomal aberrations and percentage of total abnormalities. Scale bar = 10 μm. The data are represented as the means ± S.D. of three independent experiments * p < 0.05, ** p < 0.01, *** p < 0.001 and ns (non-significant). Statistical significance analysis was carried out through a one-way analysis of variance (ANOVA) prism.

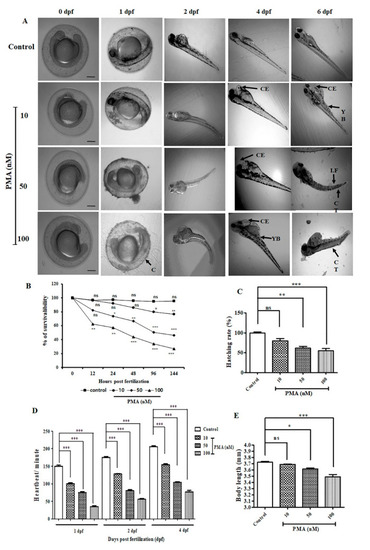
PMA exerted various deformities in zebrafish embryo and larvae (n = 10/group). (A) Morphological images of the development of zebrafish embryo to larval stage. Images were captured from 0.5–6 dpf. Common observed deformities were C (coagulation), CE (cardiac edema), CT (curved tail), LF (lack of tail fins), YB (development of yolk bags. Scale bar = 200 μM at 4× magnification. (B) Percentage of survivability (C) Percentage of hatching rate (D) Determination of heartbeat per minute of on 1 dpf, 2 dpf, and 4 dpf. (E) The data are represented as the means ± S.D. of three independent experiments * p < 0.05, ** p < 0.01, *** p < 0.001 and ns (non-significant). Statistical significance analysis was carried out through a one-way analysis of variance (ANOVA) prism.

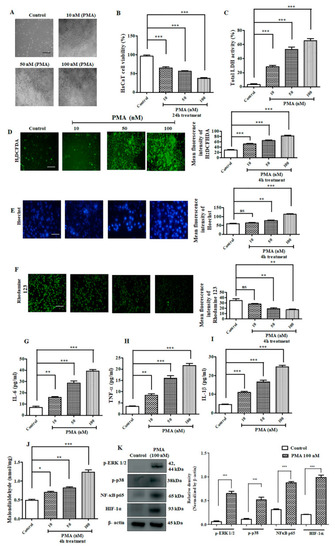
Effect of PMA on immortalized human keratinocyte (HACaT) cells. (A) Morphological image of HaCaT cells captured after 24 h of treatment with different concentration of PMA at different concentration (10 nM, 50 nM, 100 nM). Scale bar (100 μM), (B) HaCaT cell viability after 24 h PMA treatment, (C) LDH assay on HaCaT cells after 24 h PMA treatment, (D) H2 DCFDA staining on HaCaT cells after 4 h PMA treatment (E) Hoechst staining on HaCaT cells after 4 h PMA treatment, (F) rhodamine 123 staining on HaCaT cells after 4 h PMA treatment, (100 μM), (G) IL-6 estimation on HaCaT cells, (H) TNF-α estimation, (I) IL-1β estimation, (J) Malondialdehyde assay, (K) Western blotting analysis. Densitometry analysis of these respective proteins were normalized by β-actin and evaluated through Image J software. The data are represented as mean ± S.D. of three independent experiments * p < 0.05, ** p < 0.01, *** p < 0.001 and ns (non-significant). Control vs. PMA. Statistical significance analysis was carried out through a one-way analysis of variance (ANOVA) prism.

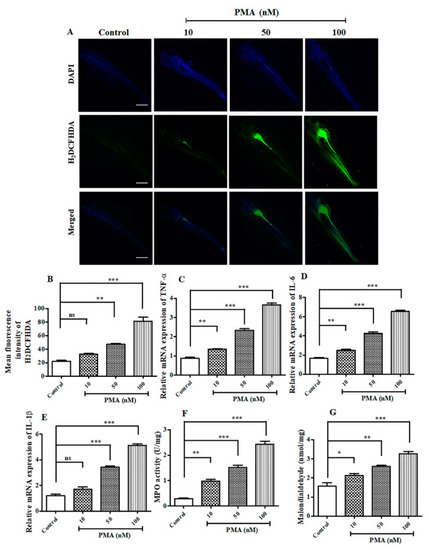
PMA induced elevated reactive oxygen species (ROS) and inflammatory response in Zebrafish larvae. (A) H2 DCFDA staining on Zebrafish larvae after PMA treatment on 6 dpf larvae, scale bar = 200 μM at 4× magnification (B) Mean fluorescence intensity of H2 DCFDA, (C) Relative mRNA expression of TNF-α, (D) Relative mRNA expression of IL-6, (E) Relative mRNA expression of IL-1β, (F) Myeloperoxidase assay, (G) Malondialdehyde assay. The data are represented as mean ± S.D. of three independent experiments * p < 0.05, ** p < 0.01, *** p < 0.001 and ns (non-significant). Control vs. PMA. Statistical significance analysis was carried out through a one-way analysis of variance (ANOVA) prism.

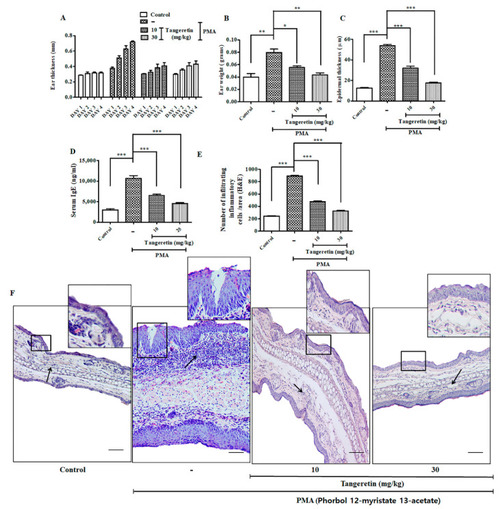
Tangeretin (TAN) remarkably ameliorated PMA induced epidermal hyperplasia intra-epidermal neutrophilic abscesses (mice, n = 5/group). (A) Ear thickness was measured every day after topical treatment of PMA and TAN for 3 days, (B) Ear weight of different mice group after sacrifice, (C) Epidermal thickness of mice ears measured through hematoxylin and eosin (H&E) staining data, (D) Serum IgE estimation from PMA treated mice, (E) Estimating the infiltrating inflammatory cells/area from H&E staining images, (F) Representative images of mice ear tissues after PMA induced inflammation measured through H&E staining. Square: the regions under the square represent massive re-epithelialization occurring after PMA treatment over a period of 3 days. Newly formed, thick epidermis as observed on PMA group. Black arrow: the marked regions on the images shows highly aggregated granulation tissue and an inflammatory cell rush comprising of scattered neutrophils, macrophages and other inflammatory cells. Scale bar (100 μM). The data are represented as mean ± S.D. of two independent experiments * p < 0.05, ** p < 0.01, *** p < 0.001 and ns (non-significant). Control vs. PMA, PMA vs. TAN 10 mg/kg and 30 mg/kg. Statistical significance analysis was carried out through a one-way analysis of variance (ANOVA) prism.

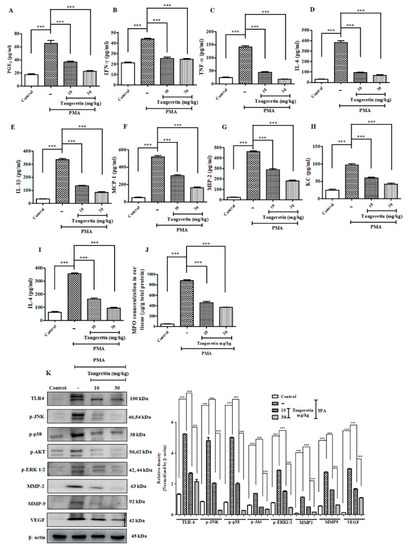
TAN exhibited potent anti-inflammatory response and blockaded cell proliferation pathway. Measurement of different inflammatory markers on mice after PMA treatment estimated by ELISA analysis. (A) PGE2, (B) IFN-γ, (C) TNF-α, (D) IL-6, (E) IL-1β, (F) Cox-2, (G) MCP-1, (H) MIP-2, (I) Keratinocyte chemoattractant (KC), (J) IL-4, (K) myeloperoxidase assay (MPO), Western blotting analysis on ear tissue homogenates showed that TAN was able to significantly reduce the inflammatory response challenged by PMA (10 μg/ear) and blockade the cell proliferation pathway validated. Densitometry analysis of these respective proteins were normalized by β-actin and evaluated through Image J software. The data are represented as mean ± S.D. of three independent experiments *** p < 0.001. PMA vs. control, TAN 10 mg/kg and 30 mg/kg vs. PMA. Statistical significance analysis was carried out through a one-way analysis of variance (ANOVA) prism.

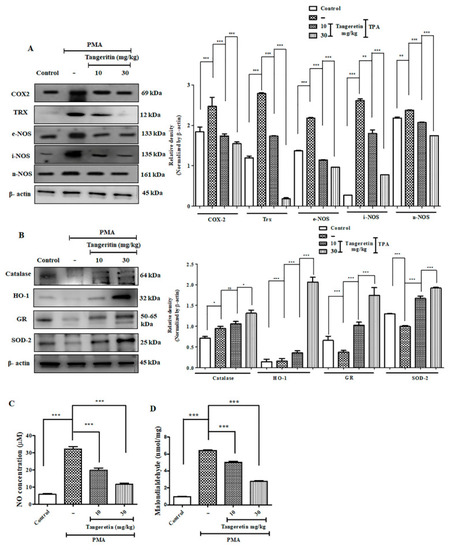
TAN neutralized PMA induced elevated ROS production by promoting antioxidant response. (A) Western blotting analysis of oxidative stress and inflammation markers evaluated from ear tissue homogenates, (B) Western blotting analysis of antioxidant activity markers evaluated from ear tissue homogenates, (C) Nitric oxide assay evaluated from mice ear tissue homogenates, (D) Malondialdehyde lipid peroxidation assay. Densitometry analysis of these respective proteins were normalized by β-actin and evaluated through Image J software. The data are represented as mean ± S.D. of three independent experiments * p < 0.05, ** p < 0.01, *** p < 0.001 and ns (non-significant). PMA vs. control, PMA vs. TAN 10 mg/kg and 30 mg/kg. Magnification = 200×. Statistical significance analysis was carried out through a one-way analysis of variance (ANOVA) prism.

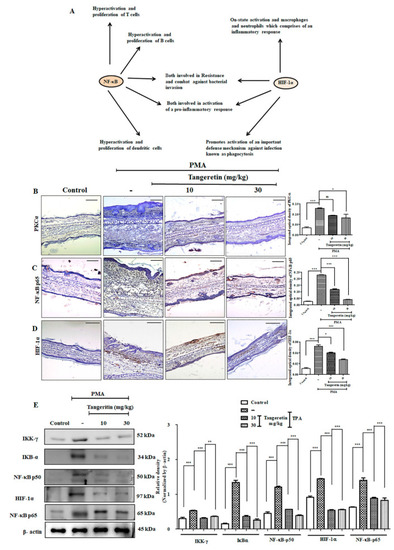
TAN blocks PMA induced hypoxia-inducible factor 1-alpha (HIF-1α) and nuclear factor kappa-light-chain-enhancer of activated b cells (NF-κB) inflammatory crosstalk. (A) Concept building diagram representing the interaction and crosstalk between HIF-1α and NF-κB after PMA challenge on mice ears, (B) PKCα expression on mice ear tissues evaluated by immunohistochemical analysis, (C) NF-κB-p65 levels evaluated by immunohistochemical analysis, (D) HIF-1α evaluated by immunohistochemical analysis, (E) Western blotting analysis cytoplasmic HIF-1α and NF-κB pathway markers evaluated from ear tissue homogenates. Scale bar (100 μM). Magnification = 200×. Statistical significance analysis was carried out through a one-way analysis of variance (ANOVA) prism. * p < 0.05, ** p < 0.01, *** p < 0.001 and ns (non-significant).

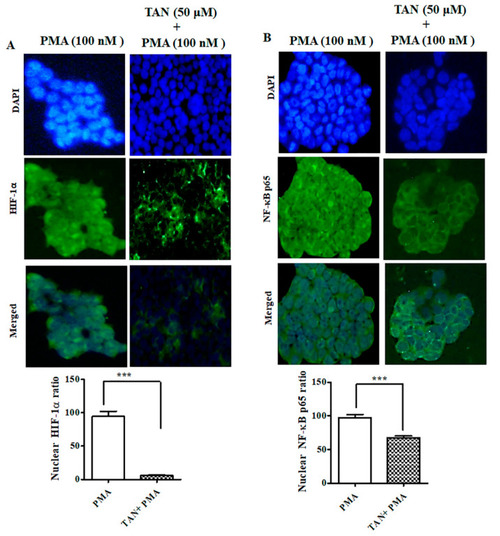
TAN inhibited PMA induced NF-κB-p65 and HIF-1α nuclear translocation on HaCaT cells. (A) Immunofluorescence staining of HIF-1α after treatment with tangeretin (50 μM, 24 h) and PMA (100 nM, 4 h), (B) Immunofluorescence staining of NF-κB-p65 after treatment with tangeretin (50 μM, 24 h) and PMA (100 nM, 4 h). Scale bar (100 μM). Magnification = 200×. *** p < 0.001.

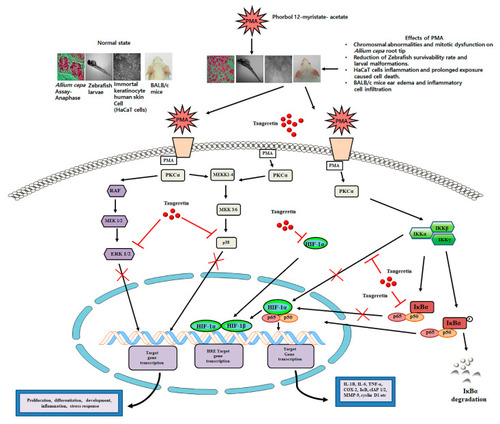
A schematic illustration of the role of tangeretin in counteracting PMA-induced inflammatory response on in vitro and in vivo model systems.

Acknowledgments
This image is the copyrighted work of the attributed author or publisher, and ZFIN has permission only to display this image to its users. Additional permissions should be obtained from the applicable author or publisher of the image. Full text @ Int. J. Mol. Sci.