IMAGE

Figure 3

ID
ZDB-IMAGE-201214-13
Source
Figures for Chang et al., 2020
Image
Figure Caption

Figure 3

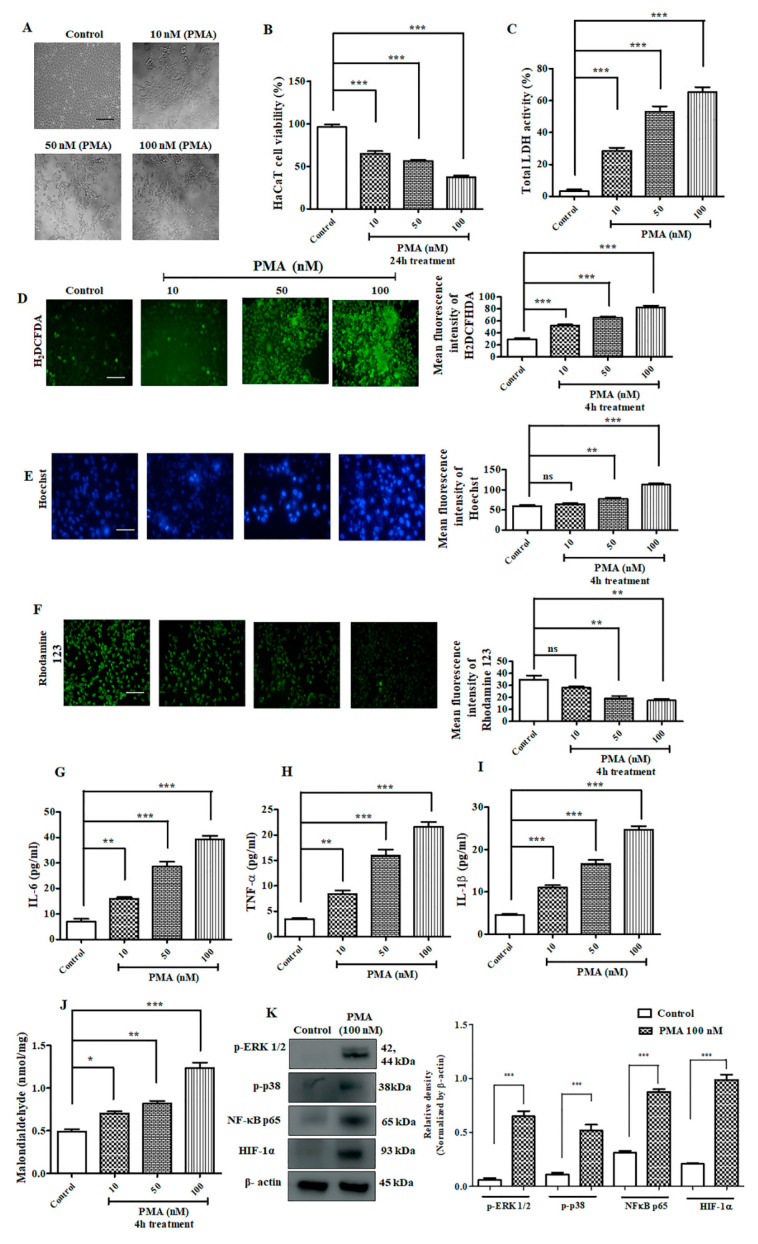
Effect of PMA on immortalized human keratinocyte (HACaT) cells. (A) Morphological image of HaCaT cells captured after 24 h of treatment with different concentration of PMA at different concentration (10 nM, 50 nM, 100 nM). Scale bar (100 μM), (B) HaCaT cell viability after 24 h PMA treatment, (C) LDH assay on HaCaT cells after 24 h PMA treatment, (D) H2 DCFDA staining on HaCaT cells after 4 h PMA treatment (E) Hoechst staining on HaCaT cells after 4 h PMA treatment, (F) rhodamine 123 staining on HaCaT cells after 4 h PMA treatment, (100 μM), (G) IL-6 estimation on HaCaT cells, (H) TNF-α estimation, (I) IL-1β estimation, (J) Malondialdehyde assay, (K) Western blotting analysis. Densitometry analysis of these respective proteins were normalized by β-actin and evaluated through Image J software. The data are represented as mean ± S.D. of three independent experiments * p < 0.05, ** p < 0.01, *** p < 0.001 and ns (non-significant). Control vs. PMA. Statistical significance analysis was carried out through a one-way analysis of variance (ANOVA) prism.

Acknowledgments
This image is the copyrighted work of the attributed author or publisher, and ZFIN has permission only to display this image to its users. Additional permissions should be obtained from the applicable author or publisher of the image. Full text @ Int. J. Mol. Sci.