FIGURE SUMMARY
Title

Light-triggered switching of liposome surface charge directs delivery of membrane impermeable payloads in vivo

Authors
Arias-Alpizar, G., Kong, L., Vlieg, R.C., Rabe, A., Papadopoulou, P., Meijer, M.S., Bonnet, S., Vogel, S., van Noort, J., Kros, A., Campbell, F.
Source
Full text @ Nat. Commun.

Photoswitching the surface charge of a liposome – from neutral to cationic – requires photoactive lipids embedded within a liposome membrane.

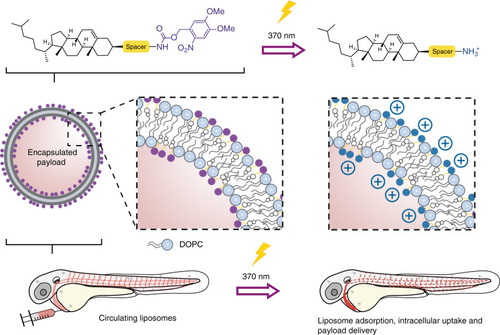
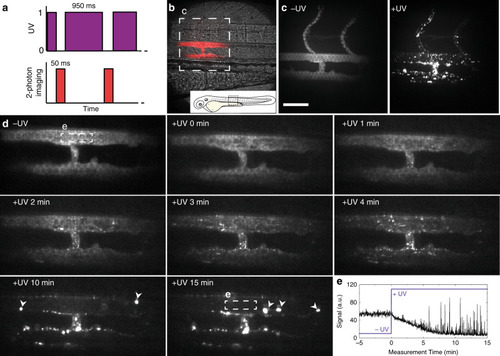
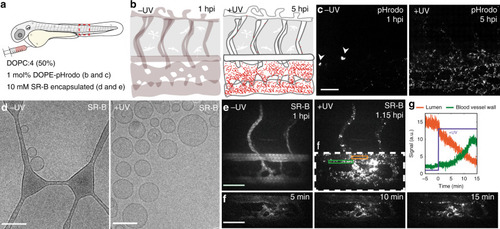
Prior to light activation, charge neutral, photoactive liposomes freely circulate throughout the vasculature of a zebrafish embryo and do not interact with RES cell types, or any other cell type, of the embryonic fish. Upon light irradiation and photolysis of photocaged, cholesterylamine lipids, rapid surface charge switching, from neutral to cationic, leads to non-specific adsorption of liposomes across the endothelium of the embryo, liposome uptake and intracellular delivery of liposome-encapsulated, membrane impermeable payloads. DOPC 1,2-dioleoyl-sn-glycero-3-phosphocholine.

Varying cholesterylamine content within DOPC liposomes.

a Cationic cholesterylamine analogues, 1-3. b Measured surface charges (ζ-potential) of DOPC liposomes containing varying mol% 1-3. DOPC:DOTAP (1:1) liposomes are included as a representative (commercially available) cationic liposome formulation. Measure of centre: mean; Error bars: standard deviation.

Biodistribution of cationic, DOPC:3 liposomes in embryonic zebrafish.

a Schematic showing the site of microinjection within a zebrafish embryo, two days post-fertilisation (dpf). Boxed region showing the organisation of blood vessels/macrophages within the tail of the embryo. DA dorsal aorta, CHT caudal hematopoietic tissue, CV caudal vein, ISV intersegmental vessel. Black arrows indicate direction of blood flow. b–i Biodistribution of DOPC liposomes containing cholesterylamine, 3, at varying mol%. Whole embryo (×10 magnification) and tissue level (×40 magnification) views of liposome distribution in kdrl:GFP transgenic embryos, stably expressing GFP in all endothelial cells, at 1 hpi. White arrowheads indicate apparent liposome uptake within blood resident macrophages, based on location and cell morphology. j, k Tissue and cellular (×63 magnification) level views of DOPC:3 (10 mol% 3) liposome distribution in mpeg1:GFP transgenic embryos, stably expressing GFP in all macrophages, at 1hpi. Extensive fluorescence co-localization of liposomes and transgenic GFP confirmed the uptake of DOPC:3 (10 mol% 3) liposomes in blood resident macrophages of the zebrafish embryo. Slight variations in the positions of macrophages (between j and k) are due to macrophage migration during the time taken to change magnification settings on the confocal microscope. All liposomes b–k contained 1 mol% fluorescent lipid probe, DOPE-LR, for visualisation. Scale bars: 200 μm (whole embryo); 50 μm (tissue level); 10 μm (cellular level).

Photoswitching liposome surface charge in vitro and in vivo.

a Chemical structure of 4 and its photolysis to 3. b Evolution of measured surface charge of DOPC:4 liposomes (1:1) as a function of UV (370 ± 7 nm, 202 mW cm−2) irradiation time. Note: batch-to-batch variation resulted in measured zeta potentials of DOPC:4 → 3 liposomes ranging from +20 to +35 mV. Data presented is representative of liposomes used in Fig. 3h–m. 100% DOPC control liposomes demonstrate surface charge of liposomes without photoactive lipids is unaffected by UV irradiation. c Cryo-TEM images of DOPC:4 before and after in situ irradiation (15 min, 370 ± 7 nm, 202 mW cm−2). Scale bar: 200 nm. See Supplementary Information Fig. 5 for low magnification cryoTEM images. d, e Whole embryo and tissue level views of DOPC:4 liposome biodistribution following co-injection with fluoHA in mpeg1:mCherry transgenic embryos (2 dpf). FluoHA is a specific in vivo marker of SECs and does not compete with liposome binding25. Liposomes (d, e) contained 1 mol% fluorescent lipid probe, DOPE-Atto633, for visualization. f Tissue level organization of macrophages and fluoHA-labelled SECs within the tail region of an mpeg1:mCherry embryo (2 dpf). g Quantification of DOPC:4 liposome levels in circulation based on mean liposome fluorescence intensity in the lumen of the DA at 0.5, 1, 2, 4 and 24 hpi (measure of centre: median; error bars: standard deviation); n = 6 (0.5 and 1 hpi) and n = 3 (2, 4 and 24 hpi) individually injected embryos per formulation per time point (see Fig. S7 for individual images). h–j Whole embryo and tissue level views of DOPC:4 liposome biodistribution in kdrl:GFP embryos, prior to UV irradiation, 1 hpi. k–m Whole embryo and tissue level views of DOPC: 4 → 3 liposome biodistribution in kdrl:GFP embryos, directly after in situ irradiation (15 min, 370 ± 7 nm, ~90 mW cm−2, ~2.4 J per embryo), ~1.5 hpi. Liposomes (h–m) contained 1 mol% fluorescent lipid probe, DOPE-LR, for visualization. Scale bars (d–m): 200 μm (whole embryo); 50 μm (tissue level).

Real time multi-photon imaging of liposome surface charge switching in situ and in vivo.

a The zebrafish embryo was exposed to UV light between the acquisitions of the camera, resulting in a 95% duty cycle of UV illumination per frame. b Transmission image of the imaging location, emission image overlaid in red. c Maximum intensity projections of two-photon z-stacks (spanning the full width of the embryo) showing DOPC:4 liposome distribution, before and after UV exposure. These images confirm the vessel connected to, and extending dorsally from the PCV, is an ISV. d Time-lapse images of DOPC:4(→3) liposome distribution before and during UV irradiation. In later timeframes, large clusters of liposomes (indicated with white arrowheads) were observed passing through the plane of view in circulation. e Mean fluorescence intensity within the ROI (lumen of the DA, white square in (c, 15 min). Liposome fluorescence intensity immediately decreased upon UV irradiation. High intensity spikes of fluorescence, due to large circulating liposome aggregates passing through the ROI, registered from 5 min after UV irradiation start. Liposomes contained 1 mol% fluorescent lipid probe, DOPE-LR, for visualisation. Scale bars: 50 μm.

Effect of light dose on the in vivo fate of DOPC:4 liposomes.

a Reducing the UV light dose applied to the embryo increases the time taken for DOPC:4 liposomes to transition to DOPC:3 liposomes. This, in turn, increases the resident time spent by DOPC:4 → 3 liposomes at an intermediate cationic surface charge density leading to irreversible clearance of liposomes by blood resident macrophages. b–i Whole embryo and tissue level views of DOPC:4 liposome biodistribution in kdrl:GFP embryos following embryo irradiation with variable light doses (15 min, 370 ± 7 nm, ~90 mW cm−2, UV duty cycle stated for each image). Apparent liposome uptake in blood resident macrophages highlighted with white arrowheads. j–l Tissue level and zoomed views of DOPC:4 → 3 liposome biodistribution in mpeg1:GFP embryos following embryo irradiation at 25% UV duty cycle (15 min, 370 ± 7 nm, 0.6 J per embryo). Liposomes contained 1 mol% fluorescent lipid probe, DOPE-LR, for visualisation. Scale bars: 200 μm (whole embryo); 50 μm (tissue level), 10 μm (zoomed).

Cellular fate of DOPC:4 → 3 liposomes and their encapsulated payloads.

a, b Schematics showing the site of microinjection within a 2 dpf embryo and the evolving fluorescence of pHrodo-containing DOPC:4 → 3 liposomes within the tail region of a wildtype (AB/TL) embryonic zebrafish, over time. The fluorescence intensity of pHrodo increases >100-fold in mildly acidic environments (e.g. late endosomes/lysosomes, pH < 6) and is, therefore, particularly apparent within SECs—cells with exceptionally high lysosomal activity. c Tissue level views of evolving pHrodo-associated fluorescence over time either in the absence of UV irradiation and following in situ UV irradiation (15 min, 370 ± 7 nm, 2.4 J cm−2). In the absence of UV irradiation, pHrodo-associated fluorescence is observed within a small number of cells within the CHT of the embryo (white arrowheads). Liposomes contained 1 mol% DOPE-pHrodo for visualisation. Scale bar: 50 μm. d CryoTEM images of SR-B filled, DOPC:4 liposomes before and after in situ irradiation (15 min, 370 ± 7 nm, 202 mW cm−2). Scale bars: 100 nm. e Maximum intensity projections of two-photon z-stacks (spanning the full width of the embryo) showing SR-B filled DOPC:4 liposome distribution, before and after UV irradiation. Scale bar: 50 μm. f Time-lapse images of SR-B filled DOPC: 4 → 3 liposome distribution during UV irradiation. Scale bar: 50 μm. g Mean SR-B fluorescence intensity within ROIs (lumen of the DA, orange line; DA vessel wall, green line, shown in e), before and during UV irradiation. SR-B fluorescence intensity in circulation decreases upon UV irradiation with a concomitant increase in SR-B fluorescence intensity associated with the DA blood vessel wall. Liposomes (e–g) containing encapsulated SR-B (10 mM) and otherwise unlabelled.

Acknowledgments
This image is the copyrighted work of the attributed author or publisher, and ZFIN has permission only to display this image to its users. Additional permissions should be obtained from the applicable author or publisher of the image. Full text @ Nat. Commun.