IMAGE

Fig. 3

ID
ZDB-IMAGE-200724-3
Source
Figures for Arias-Alpizar et al., 2020
Image
Figure Caption

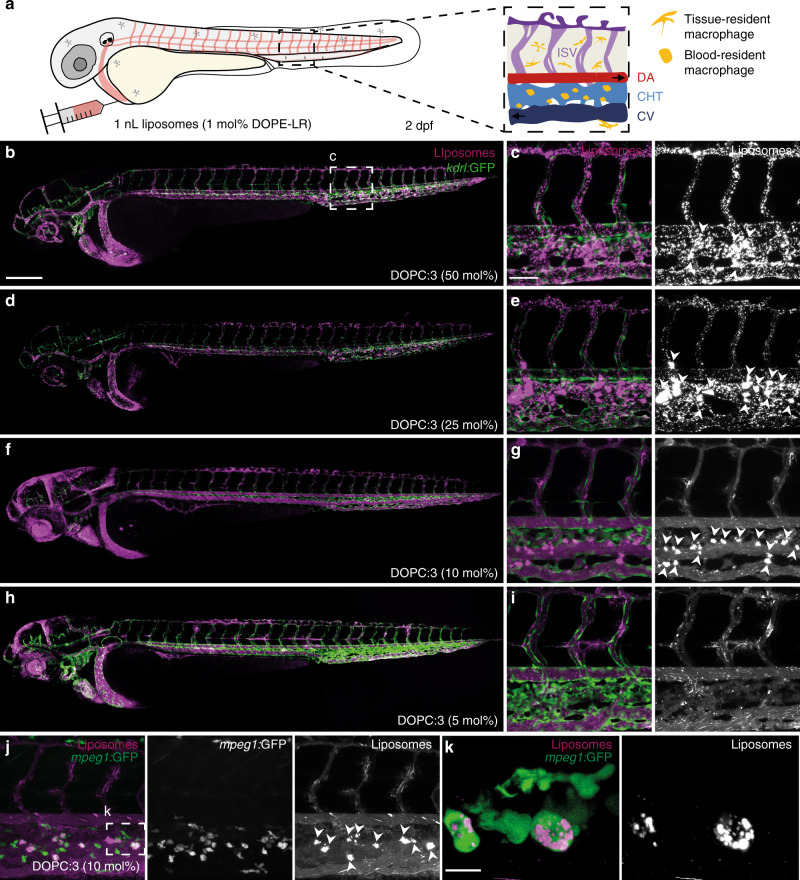
Fig. 3 Biodistribution of cationic, DOPC:3 liposomes in embryonic zebrafish.

a Schematic showing the site of microinjection within a zebrafish embryo, two days post-fertilisation (dpf). Boxed region showing the organisation of blood vessels/macrophages within the tail of the embryo. DA dorsal aorta, CHT caudal hematopoietic tissue, CV caudal vein, ISV intersegmental vessel. Black arrows indicate direction of blood flow. b–i Biodistribution of DOPC liposomes containing cholesterylamine, 3, at varying mol%. Whole embryo (×10 magnification) and tissue level (×40 magnification) views of liposome distribution in kdrl:GFP transgenic embryos, stably expressing GFP in all endothelial cells, at 1 hpi. White arrowheads indicate apparent liposome uptake within blood resident macrophages, based on location and cell morphology. j, k Tissue and cellular (×63 magnification) level views of DOPC:3 (10 mol% 3) liposome distribution in mpeg1:GFP transgenic embryos, stably expressing GFP in all macrophages, at 1hpi. Extensive fluorescence co-localization of liposomes and transgenic GFP confirmed the uptake of DOPC:3 (10 mol% 3) liposomes in blood resident macrophages of the zebrafish embryo. Slight variations in the positions of macrophages (between j and k) are due to macrophage migration during the time taken to change magnification settings on the confocal microscope. All liposomes b–k contained 1 mol% fluorescent lipid probe, DOPE-LR, for visualisation. Scale bars: 200 μm (whole embryo); 50 μm (tissue level); 10 μm (cellular level).

Acknowledgments
This image is the copyrighted work of the attributed author or publisher, and ZFIN has permission only to display this image to its users. Additional permissions should be obtained from the applicable author or publisher of the image. Full text @ Nat. Commun.