
- Title
-
Two genomic regions encoding exopolysaccharide production systems have complementary functions in B. cereus multicellularity and host interaction
- Authors
- Caro-Astorga, J., Álvarez-Mena, A., Hierrezuelo, J., Guadix, J.A., Heredia-Ponce, Z., Arboleda-Estudillo, Y., González-Munoz, E., de Vicente, A., Romero, D.
- Source
- Full text @ Sci. Rep.
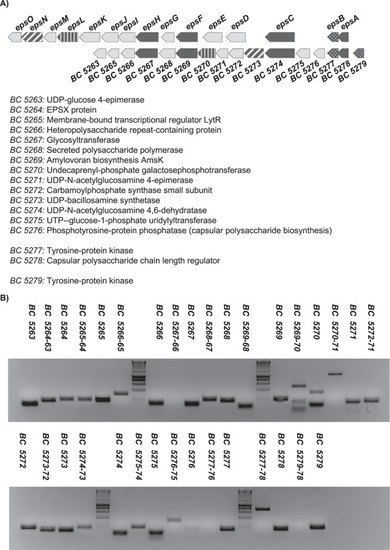
The |
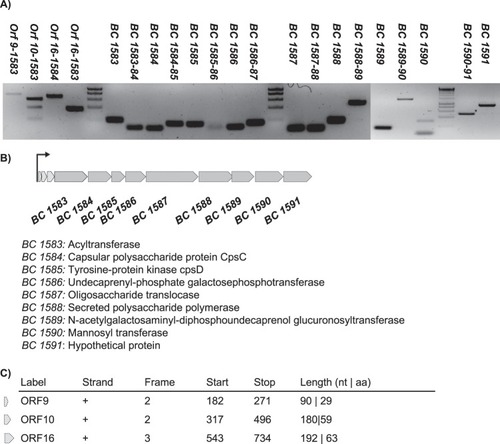
The |
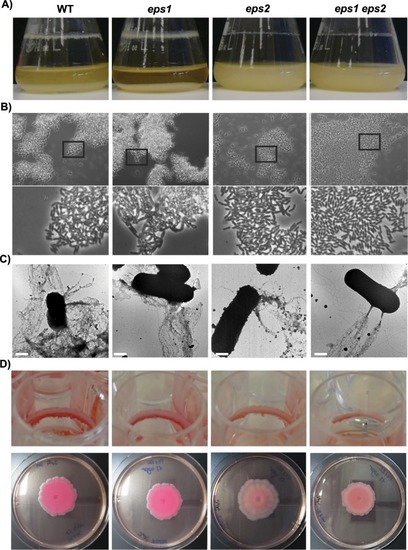
Biofilm phenotypes of the WT and |
Eps1 and Eps2 prevent cellular auto-aggregation. The optical densities (ODs) of cultures grown in TY medium incubated at 30 °C for 16 h with shaking at 150 rpm were adjusted to OD = 3 before the experiments were initiated. ( |
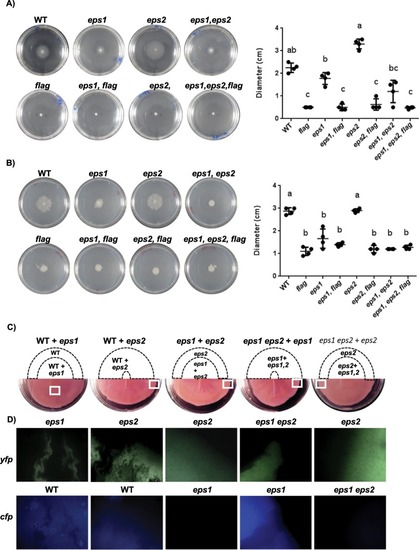
EPS1 and EPS2 contribute differently to bacterial cell motility. Cell suspensions were spotted in the centers of the plates, which were then incubated at 28 °C before examining the motility. ( |
EPS2 is more important for the adhesion of |