IMAGE

Figure 5

ID
ZDB-IMAGE-200131-11
Source
Figures for Caro-Astorga et al., 2020
Image
Figure Caption

Figure 5

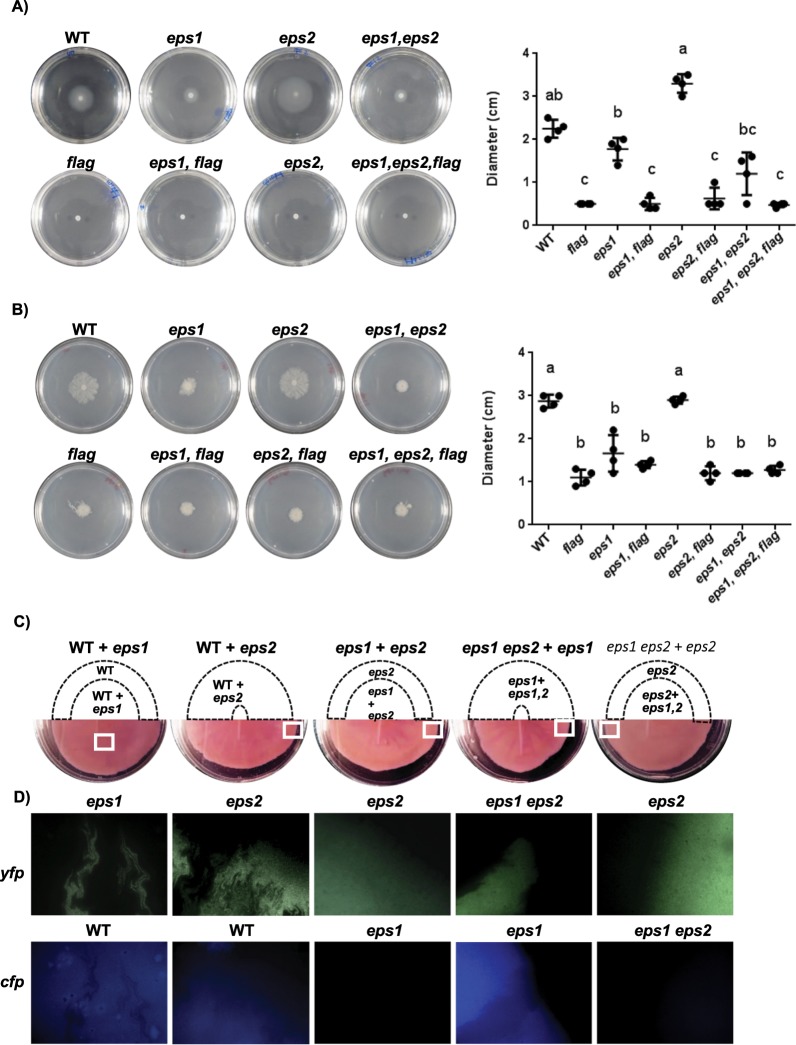
EPS1 and EPS2 contribute differently to bacterial cell motility. Cell suspensions were spotted in the centers of the plates, which were then incubated at 28 °C before examining the motility. (A) Images taken from the swimming agar plates (0.3% TY agar plates, 24 h). (B) Images taken from the swarming agar plates (0.7% TY agar plates, 72 h). The graphs represent the values of the colony diameters at the end of each experiment. A Tukey statistical analysis was realized (p-value < 0.01) and the significant differences are indicated with letters. (C,D) Bacterial strains constitutively expressing YFP or CFP were mixed at a 1:1 ratio and then spotted in the centers of the plates. (C) The motility and Congo Red binding phenotypes were analyzed on TY swarming agar plates supplemented with Congo Red. The drawing indicates the zone occupied by each strain in the corresponding complementation experiment and marked with squares in the original picture (bottom). (D) Fluorescence microscopy images showing the presence of each bacterial strain in the same section indicated in panel C, bottom.

Acknowledgments
This image is the copyrighted work of the attributed author or publisher, and ZFIN has permission only to display this image to its users. Additional permissions should be obtained from the applicable author or publisher of the image. Full text @ Sci. Rep.