
- Title
-
TrkB hyperactivity contributes to brain dysconnectivity, epileptogenesis, and anxiety in zebrafish model of Tuberous Sclerosis Complex
- Authors
- Kedra, M., Banasiak, K., Kisielewska, K., Wolinska-Niziol, L., Jaworski, J., Zmorzynska, J.
- Source
- Full text @ Proc. Natl. Acad. Sci. USA
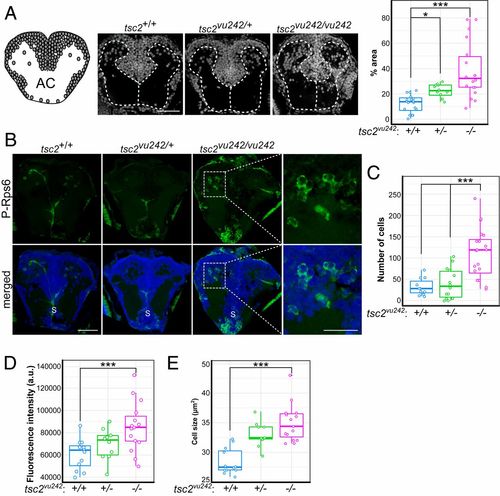
tsc2vu242vu/242 exhibit WM disruption and mTorC1 activation in the pallium. (A) Organization of gray matter and WM in coronal section through the AC. Circles represent cell bodies. Sample photographs of tsc2vu242 brain sections that were stained with DAPI are shown, together with the relative number of cell bodies in WM compartments in tsc2vu242 brains [H = 24.443, P = 4.92 × 10⁻⁶; P = 3.1 × 10⁻⁶ for tsc2vu242/vu242 vs. tsc2+/+, P = 0.017 for tsc2vu242/+ vs. tsc2+/+ (Dunn’s test)]. (Scale bar, 40 μm.) (B) Representative images of coronal tsc2vu242 sections through the pallium that were immunostained with anti–P-Rps6 antibody (green). S, subpallium. [Scale bars, 40 and 20 μm (magnification).] (C) The number of P-Rps6–positive neurons in the telencephalon in tsc2vu242 [H = 18.88, P = 7.95 × 10⁻⁵; P = 0.00071 for tsc2vu242/vu242 vs. tsc2+/+, P = 0.00117 for tsc2vu242/vu242 vs. tsc2vu242/+ (Dunn’s test)]. (D) Mean phosphorylation levels of P-Rps6 per cell per fish in the telencephalon in tsc2vu242 [F = 6.772, P = 0.00335; P = 0.0019 for tsc2vu242/vu242 vs. tsc2+/+, P = 0.0696 for tsc2vu242/vu242 vs. tsc2vu242/+ (Dunnett’s test)]. (E) Mean soma size of P-Rps6–positive neurons per fish in the telencephalon in tsc2vu242 [F = 21.48, P = 9.3 × 10⁻⁷; P = 4.1 × 10⁻⁷ for tsc2vu242/vu242 vs. tsc2+/+, P = 0.133 for tsc2vu242/vu242 vs. tsc2vu242/+ (Dunnett’s test)]. *P < 0.05, ***P < 0.005. |
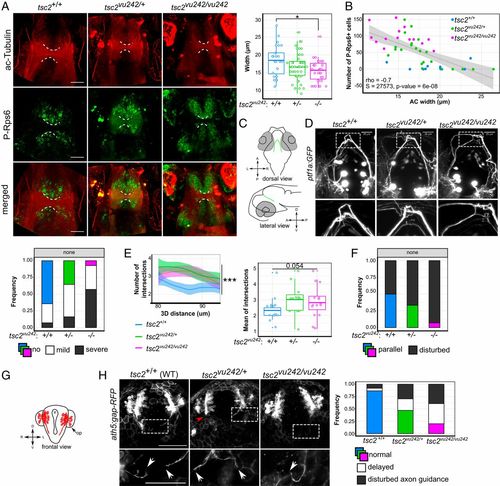
tsc2vu242vu/242 exhibit WM dysconnectivity resulting from aberrant axon elongation. (A) Representative horizontal optical sections through tsc2vu242 brains that were double-immunostained with anti–acetylated-Tubulin (ac-Tubulin; red) and anti–P-Rps6 (green) antibodies that show the AC (dashed lines) at 7.5 days post fertilization, together with the quantification of the width of the AC [F = 4.053, P = 0.0202; P = 0.011 for tsc2vu242/vu242 vs. tsc2+/+ (Dunnett’s test)]. (Scale bars, 30 μm.) (B) Correlation analysis of the number of P-Rps6–positive cells in the brain and the width of the AC, showing negative Spearman correlation and genotype clustering. (C) Schematic diagram of the localization of ptf1a:GFP-positive neurons in the posterior tuberculum that extend their axons dorsally and cross the brain midline through the posterior commissure. (D) Representative confocal images of a dorsal view of ptf1a:GFP-positive axons that show axonal tract fasciculation at the midline. The frequency of various ptf1a:GFP axonal phenotypes with various severity was quantified. (Scale bar, 25 μm.) (E) Sholl analysis of ptf1a:GFP-positive axon bundles at the midline of the tsc2vu242 brains, including the number of intersections over the 3D distance from the soma [regression curves with confidence intervals; F = 23.84, P = 7.4 × 10⁻¹¹; P = 2.3 × 10⁻⁶, tsc2vu242/vu242 vs. tsc2+/+ (Dunnett’s test); n = 16 tsc2vu242/vu242, n = 13 tsc2vu242/+, n = 15 tsc2+/+] and the mean number of intersections with the data distribution. For tsc2+/+, the Sholl function converged on the value of 2 at a distance of 80 to 90 μm, representing two tracts that crossed the midline, one for each hemisphere. tsc2vu242/vu242 fish did not present this tendency, and the average number of axons at the midline was higher than in tsc2+/+. (F) Frequency of parallelization of ptf1a:GFP> tracts from each hemisphere in the posterior commissure in the brain in tsc2vu242 fish (n = 27 tsc2vu242/vu242, n = 31 tsc2vu242/+, n = 18 tsc2+/+). (G) Schematic diagram of the localization of ath5:gap-RFP-positive commissures in the brain in tsc2vu242 fish at 24 hpf. op, olfactory placodes; v, brain ventricle. (H) Representative confocal images of a frontal view of ath5:gap-RFP–positive neurons that show axon elongation (white arrows indicate axons) and the occurrence of various axonal phenotypes during olfactory medial tract development [genotype × phenotype: F = 8.677, P = 8.5 × 10⁻⁴; P = 0.077, tsc2vu242/vu242 vs. tsc2+/+ (Dunnett’s test); n = 18 tsc2vu242/vu242, nn = 60 tsc2vu242/+, n = 25 tsc2+/+]. (Scale bars, 100 μm.) *P < 0.05, ***P < 0.005. |
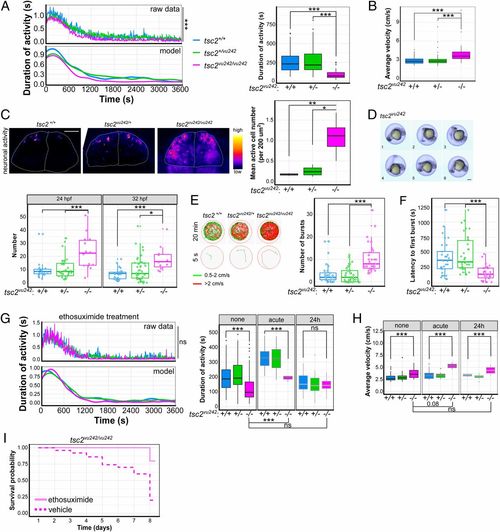
tsc2vu242vu/242 exhibit decrease in activity, increase in epileptogenesis, and increase in response to ethosuximide treatment. (A) Activity analysis of tsc2vu242 fish that shows activity vs. time [F = 2.601, P = 0.0067; P = 2.38 × 10⁻⁹ for tsc2vu242/vu242 vs. tsc2+/+, P = 7.42 × 10⁻⁶ for tsc2vu242/vu242 vs. tsc2vu242/+ (Dunnett’s test)] and cumulative activity [F = 18.61, P = 4.76 × 10⁻⁸; P = 4.16 × 10⁻⁸ for tsc2vu242/vu242 vs. tsc2vu242/+, P = 1.22 × 10⁻⁶ for tsc2vu242/vu242 vs. tsc2+/+ (Dunnett’s test)] in tsc2vu242/vu242 fish (n = 32) compared with tsc2vu242/+ fish (n = 85) and tsc2+/+ control siblings (n = 50) during 1 h of tracking. (B) Average velocity of high-velocity movements (>2 cm/s) of tsc2vu242/vu242 fish compared with tsc2vu242/+ and tsc2+/+ controls [H = 31.73, P = 1.29 × 10⁻⁷; P = 4.8 × 10⁻⁶ for tsc2vu242/vu242 vs. tsc2+/+, P = 2.1 × 10⁻⁷ for tsc2vu242/vu242 vs. tsc2vu242/+ (Dunn’s test)]. (C) Representative images that show neuronal activity (without any stimulation) in the pallium in tsc2vu242 fish and the mean number of active cells, which increases in tsc2vu242/vu242 [F = 9.638, P = 0.0074; P = 0.009 for tsc2vu242/vu242 vs. tsc2+/+, P = 0.012 for tsc2vu242/vu242 vs. tsc2+/vu242 (Dunnett’s test)]. (Scale bar, 30 µm.) (D) Exemplary time-lapse photographs of STFBC of tsc2vu242 fish and quantification at 24 hpf [F = 8.59, P = 5 × 10⁻⁴; P ≤ 0.001 for tsc2vu242/vu242 vs. other genotypes (Dunnett’s test)] and 32 hpf [F = 7.535, P = 0.001; P = 0.012 for tsc2vu242/vu242 vs. tsc2vu242/+, P = 4 × 10⁻⁴ for tsc2vu242/vu242 vs. tsc2+/+ (Dunnett’s test)]. (Scale bar, 100 μm.) (E) Representative tracks for each tsc2vu242 genotype after treatment with PTZ representing the entire 20 min and the first 5 s of tracking, showing the number of PTZ-induced seizure-like outbursts in the first 10 min of tracking for tsc2vu242/vu242 fish compared with tsc2vu242/+ and tsc2+/+ fish [H = 34.667, P = 3 × 10⁻⁸; P = 6.8 × 10⁻⁶ for tsc2vu242/vu242 vs. tsc2+/+, P = 9.1 × 10⁻⁸ for tsc2vu242/vu242 vs. tsc2vu242/+ (Dunn’s test)]. Red tracks represent high-velocity movements (>2 cm/s). Green tracks indicate free swimming (movement within a range of 0.5 to 2 cm/s). Black tracks indicate free floating (<0.5 cm/s). (F) Time to first PTZ-induced outburst for tsc2vu242/vu242 compared with control siblings [H = 26.838, P = 1.49 × 10⁻⁶; P = 3 × 10⁻⁴ for tsc2vu242/vu242 vs. tsc2+/+, P = 2.1 × 10⁻⁶ for tsc2vu242/vu242 vs. tsc2vu242/+ (Dunn’s test)]. (G) Activity analysis of tsc2vu242 fish that were treated with ethosuximide, showing activity vs. time and cumulative activity of tsc2vu242/vu242 (n = 32) compared with tsc2vu242/+ (n = 56) and tsc2+/+ (n = 25) over 1 h of tracking. An increase in activity after acute ethosuximide treatment is considered to represent anxiety-like behavior, reflected by hyperactivity regardless of genotype (H = 40.312, P = 9.15 × 10⁻⁹; P = 3.9 × 10⁻⁹ for tsc2vu242/vu242 untreated vs. treated with ethosuximide acutely, P > 0.05 for tsc2vu242/vu242 untreated vs. treated with ethosuximide for 24 h [Dunn’s test]). (H) Average velocity of high-velocity movements (>2 cm/s) of tsc2vu242/vu242 compared with tsc2vu242/+ and tsc2+/+ fish after ethosuximide treatment [H = 9.5556, P = 0.02275; P = 0.08 for tsc2vu242/vu242 untreated vs. treated with ethosuximide acutely, P > 0.05 for tsc2vu242/vu242 untreated vs. treated with ethosuximide for 24 h (Dunn’s test)]. (I) Survival probability of tsc2vu242/tsc2vu242 fish after ethosuximide treatment vs. vehicle treatment. *P < 0.05, **P < 0.01, ***P < 0.005. |
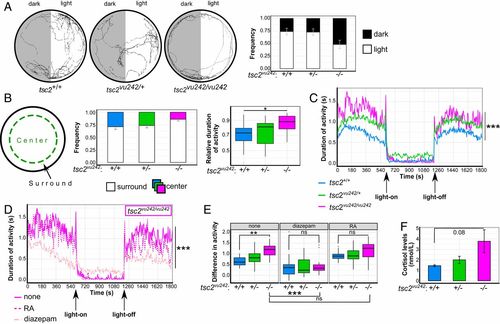
Mutant tsc2vu242/vu242 exhibit an increase in anxiety-like behavior in the open field and in response to sudden changes in light conditions and an increase in cortisol levels. (A) Light-preference analysis of tsc2vu242 fish, including representative tracks and time spent in the light and dark compartments (relative to total activity) for each tsc2vu242 genotype [genotype × treatment: F = 8.181, P = 5 × 10⁻⁴; P = 1 × 10⁻⁴ for tsc2+/+ light vs. dark, P = 3 × 10⁻⁴ for tsc2vu242/+ light vs. dark, P = 0.999 for tsc2vu242/vu242 light vs. dark (Tukey HSD test); n = 15/genotype]. The data are expressed as mean ± SEM. (B) Schematic diagram of the open field analysis of tsc2vu242 fish that shows selections of the peripheral (surround) and central (center) areas of the experimental well, time spent in the peripheral and central areas of the well (relative to total activity) for each tsc2vu242 genotype (mean ± SEM), and data distribution of the time spent in the peripheral area relative to total activity of tsc2vu242 fish [F = 3.721, P = 0.0321; P = 0.043 for tsc2vu242/vu242 vs. tsc2+/+, P = 0.11 for tsc2vu242/vu242 vs. tsc2vu242/+ (Tukey HSD test); n = 15/genotype]. (C) Mean activity over time for each tsc2vu242 genotype after sudden changes in light conditions [H = 636.14, P < 2.2 × 10⁻¹⁶; P < 7.4 × 10⁻⁸ for tsc2vu242/vu242 vs. tsc2+/+ or tsc2vu242/+ (Dunn’s test); n = 23 tsc2vu242/vu242, n = 69 tsc2vu242/+, n = 45 tsc2+/+]. (D) Mean activity over time for tsc2vu242/vu242 that were subjected to sudden changes in light conditions after treatment with anxiety-modulating drugs compared with untreated fish [H = 492.92, P < 2.2 × 10⁻¹⁶; P < 2 × 10⁻¹⁶, untreated vs. treated (Dunn’s test)]. (E) Amplitudes of activity in the dark and light phases in tsc2vu242 fish after treatment with various anxiety-modulating drugs compared with untreated fish [genotype × treatment: F = 1.806, P = 0.128; treatment: F = 43.643, P < 2 × 10⁻¹⁶; P = 0.0067 for untreated tsc2vu242/vu242 vs. tsc2+/+; P = 1.3 × 10⁻⁵ for untreated tsc2vu242/vu242 vs. treated with diazepam; P = 0.999, untreated tsc2vu242/vu242 vs. treated with RA (Tukey HSD test)]. (F) Quantification of cortisol levels in tsc2vu242 fish [F = 3.395, P = 0.103; P = 0.081, tsc2vu242/vu242 vs. tsc2+/+ (Dunnett’s test); n = 120/genotype]. *P < 0.05, **P < 0.01, ***P < 0.005, ns: not significant. PHENOTYPE:
|
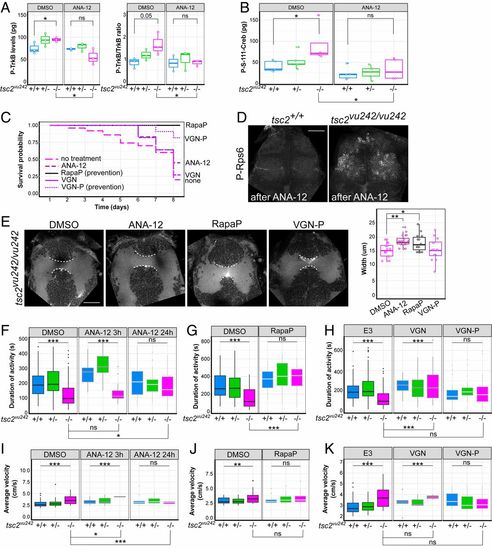
ANA-12 rescues survival, brain dysconnectivity, impairment in locomotion, and anxiety-related hypervelocity in tsc2vu242vu/242 mutants. (A) Quantification of activation of TrkB receptor judged by levels of P-TrkB and ratio of P-TrkB to TrkB by immunochemistry (ELISA) revealed higher activation levels in tsc2vu242/vu242 fish compared with control siblings and a decrease after ANA-12 treatment [P-TrkB: H = 4.355, P = 0.049; P = 0.05, tsc2vu242/vu242 vs. tsc2+/+ (Dunn’s test)]; P = 0.015, tsc2vu242/vu242 untreated vs. treated with ANA-12 (Dunn’s test); P-TrkB/TrkB: H = 5.689, P = 0.05; P = 0.05, tsc2vu242/vu242 vs. tsc2+/+ (Dunn’s test); P = 0.049, tsc2vu242/vu242 untreated vs. treated with ANA-12 (Dunn’s test)]. (B) Quantification of levels of Creb phosphorylation by immunochemistry (ELISA) revealed higher levels in tsc2vu242/vu242 compared with controls and a decrease after ANA-12 treatment [genotype: F = 3.513, P = 4.66 × 10⁻⁴; treatment: F = 14.759, P = 8.33 × 10⁻⁴; genotype × treatment: P > 0.05; P = 0.012, tsc2vu242/vu242 after ANA-12 vs. DMSO treatment (Tukey HSD test); P = 0.033, untreated tsc2vu242/vu242 vs. tsc2+/+ (Tukey HSD test)]. (C) Survival probability of tsc2vu242/vu242 after various treatments. (D) Confocal images of tsc2vu242 brains that were immunostained with anti–P-Rps6 antibody after ANA-12 treatment. (Scale bar, 30 µm.) (E) AC width in tsc2vu242/vu242 after various treatments, including representative confocal images and quantification [F = 5.83, P = 0.00142; P = 0.002 for DMSO vs. ANA-12, P = 0.049 for DMSO vs. Rapa pretreatment (Dunnett’s test)]. (Scale bar, 30 µm.) (F) Cumulative activity of tsc2vu242/vu242 after treatment with ANA-12 compared with tsc2vu242/+ and tsc2+/+ fish over 1 h of tracking, showing an increase in activity of mutant fish after treatment [H = 16.652, P = 2.42 × 10⁻⁴; P = 0.0172, tsc2vu242/vu242 untreated vs. treated with ANA-12 for 24 h (Dunn’s test)]. (G) Cumulative activity of the tsc2vu242/vu242 after the prevention of disease development by Rapa pretreatment compared with tsc2vu242/+ and tsc2+/+ fish over 1 h of tracking, showing an increase in activity of mutant fish after treatment [H = 32.18, P = 3.9 × 10⁻⁸; P = 2.0 × 10⁻⁸ for tsc2vu242/vu242 untreated vs. rapamycin pretreatment (Dunn’s test)]. (H) Cumulative activity of tsc2vu242/vu242 after the treatment with VGN or VGN-P to prevent disease development, respectively, compared with tsc2vu242/+ and tsc2+/+ fish over 1 h of tracking, showing improvements in activity after short VGN treatment but toxicity after longer treatment with VGN [H = 19.262, P = 6.566 × 10⁻⁵; P = 3.4 × 10⁻⁵ for tsc2vu242/vu242 untreated vs. treated with VGN, P > 0.05 for tsc2vu242/vu242 untreated vs. VGN-P (Dunn’s test)]. (I) Average velocity of high-velocity movements of tsc2vu242/vu242 compared with tsc2vu242/+ and tsc2+/+ fish after treatment with ANA-12 [H = 14.686, P = 6.47 × 10⁻⁴; P = 0.015 for tsc2vu242/vu242 untreated vs. treated with ANA-12 for 3 h, P = 0.003 for tsc2vu242/vu242 untreated vs. treated with ANA-12 for 24 h (Dunn’s test)]. (J) Average velocity of high-velocity movements of tsc2vu242/vu242 fish after the prevention of disease development with Rapa pretreatment compared with tsc2vu242/+ and tsc2+/+ fish [H = 29.68, P = 4.52 × 10⁻⁵; P > 0.05 for tsc2vu242/vu242 untreated vs. tsc2vu242/vu242 with Rapa pretreatment (Dunn’s test)]. (K) Average velocity of high-velocity movements of tsc2vu242/vu242 after the treatment with VGN or VGN-P to prevent disease development, respectively, compared with tsc2vu242/+ and tsc2+/+ fish (H = 3.286, P = 0.19). *P < 0.05, **P < 0.01, ***P < 0.005, ns: not significant. |