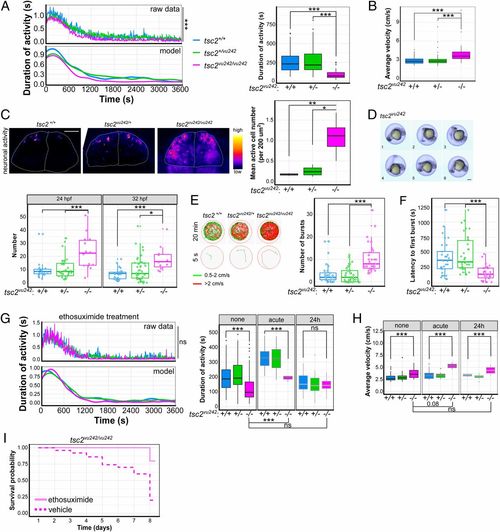
tsc2vu242vu/242 exhibit decrease in activity, increase in epileptogenesis, and increase in response to ethosuximide treatment. (A) Activity analysis of tsc2vu242 fish that shows activity vs. time [F = 2.601, P = 0.0067; P = 2.38 × 10⁻⁹ for tsc2vu242/vu242 vs. tsc2+/+, P = 7.42 × 10⁻⁶ for tsc2vu242/vu242 vs. tsc2vu242/+ (Dunnett’s test)] and cumulative activity [F = 18.61, P = 4.76 × 10⁻⁸; P = 4.16 × 10⁻⁸ for tsc2vu242/vu242 vs. tsc2vu242/+, P = 1.22 × 10⁻⁶ for tsc2vu242/vu242 vs. tsc2+/+ (Dunnett’s test)] in tsc2vu242/vu242 fish (n = 32) compared with tsc2vu242/+ fish (n = 85) and tsc2+/+ control siblings (n = 50) during 1 h of tracking. (B) Average velocity of high-velocity movements (>2 cm/s) of tsc2vu242/vu242 fish compared with tsc2vu242/+ and tsc2+/+ controls [H = 31.73, P = 1.29 × 10⁻⁷; P = 4.8 × 10⁻⁶ for tsc2vu242/vu242 vs. tsc2+/+, P = 2.1 × 10⁻⁷ for tsc2vu242/vu242 vs. tsc2vu242/+ (Dunn’s test)]. (C) Representative images that show neuronal activity (without any stimulation) in the pallium in tsc2vu242 fish and the mean number of active cells, which increases in tsc2vu242/vu242 [F = 9.638, P = 0.0074; P = 0.009 for tsc2vu242/vu242 vs. tsc2+/+, P = 0.012 for tsc2vu242/vu242 vs. tsc2+/vu242 (Dunnett’s test)]. (Scale bar, 30 µm.) (D) Exemplary time-lapse photographs of STFBC of tsc2vu242 fish and quantification at 24 hpf [F = 8.59, P = 5 × 10⁻⁴; P ≤ 0.001 for tsc2vu242/vu242 vs. other genotypes (Dunnett’s test)] and 32 hpf [F = 7.535, P = 0.001; P = 0.012 for tsc2vu242/vu242 vs. tsc2vu242/+, P = 4 × 10⁻⁴ for tsc2vu242/vu242 vs. tsc2+/+ (Dunnett’s test)]. (Scale bar, 100 μm.) (E) Representative tracks for each tsc2vu242 genotype after treatment with PTZ representing the entire 20 min and the first 5 s of tracking, showing the number of PTZ-induced seizure-like outbursts in the first 10 min of tracking for tsc2vu242/vu242 fish compared with tsc2vu242/+ and tsc2+/+ fish [H = 34.667, P = 3 × 10⁻⁸; P = 6.8 × 10⁻⁶ for tsc2vu242/vu242 vs. tsc2+/+, P = 9.1 × 10⁻⁸ for tsc2vu242/vu242 vs. tsc2vu242/+ (Dunn’s test)]. Red tracks represent high-velocity movements (>2 cm/s). Green tracks indicate free swimming (movement within a range of 0.5 to 2 cm/s). Black tracks indicate free floating (<0.5 cm/s). (F) Time to first PTZ-induced outburst for tsc2vu242/vu242 compared with control siblings [H = 26.838, P = 1.49 × 10⁻⁶; P = 3 × 10⁻⁴ for tsc2vu242/vu242 vs. tsc2+/+, P = 2.1 × 10⁻⁶ for tsc2vu242/vu242 vs. tsc2vu242/+ (Dunn’s test)]. (G) Activity analysis of tsc2vu242 fish that were treated with ethosuximide, showing activity vs. time and cumulative activity of tsc2vu242/vu242 (n = 32) compared with tsc2vu242/+ (n = 56) and tsc2+/+ (n = 25) over 1 h of tracking. An increase in activity after acute ethosuximide treatment is considered to represent anxiety-like behavior, reflected by hyperactivity regardless of genotype (H = 40.312, P = 9.15 × 10⁻⁹; P = 3.9 × 10⁻⁹ for tsc2vu242/vu242 untreated vs. treated with ethosuximide acutely, P > 0.05 for tsc2vu242/vu242 untreated vs. treated with ethosuximide for 24 h [Dunn’s test]). (H) Average velocity of high-velocity movements (>2 cm/s) of tsc2vu242/vu242 compared with tsc2vu242/+ and tsc2+/+ fish after ethosuximide treatment [H = 9.5556, P = 0.02275; P = 0.08 for tsc2vu242/vu242 untreated vs. treated with ethosuximide acutely, P > 0.05 for tsc2vu242/vu242 untreated vs. treated with ethosuximide for 24 h (Dunn’s test)]. (I) Survival probability of tsc2vu242/tsc2vu242 fish after ethosuximide treatment vs. vehicle treatment. *P < 0.05, **P < 0.01, ***P < 0.005.
|
