
|
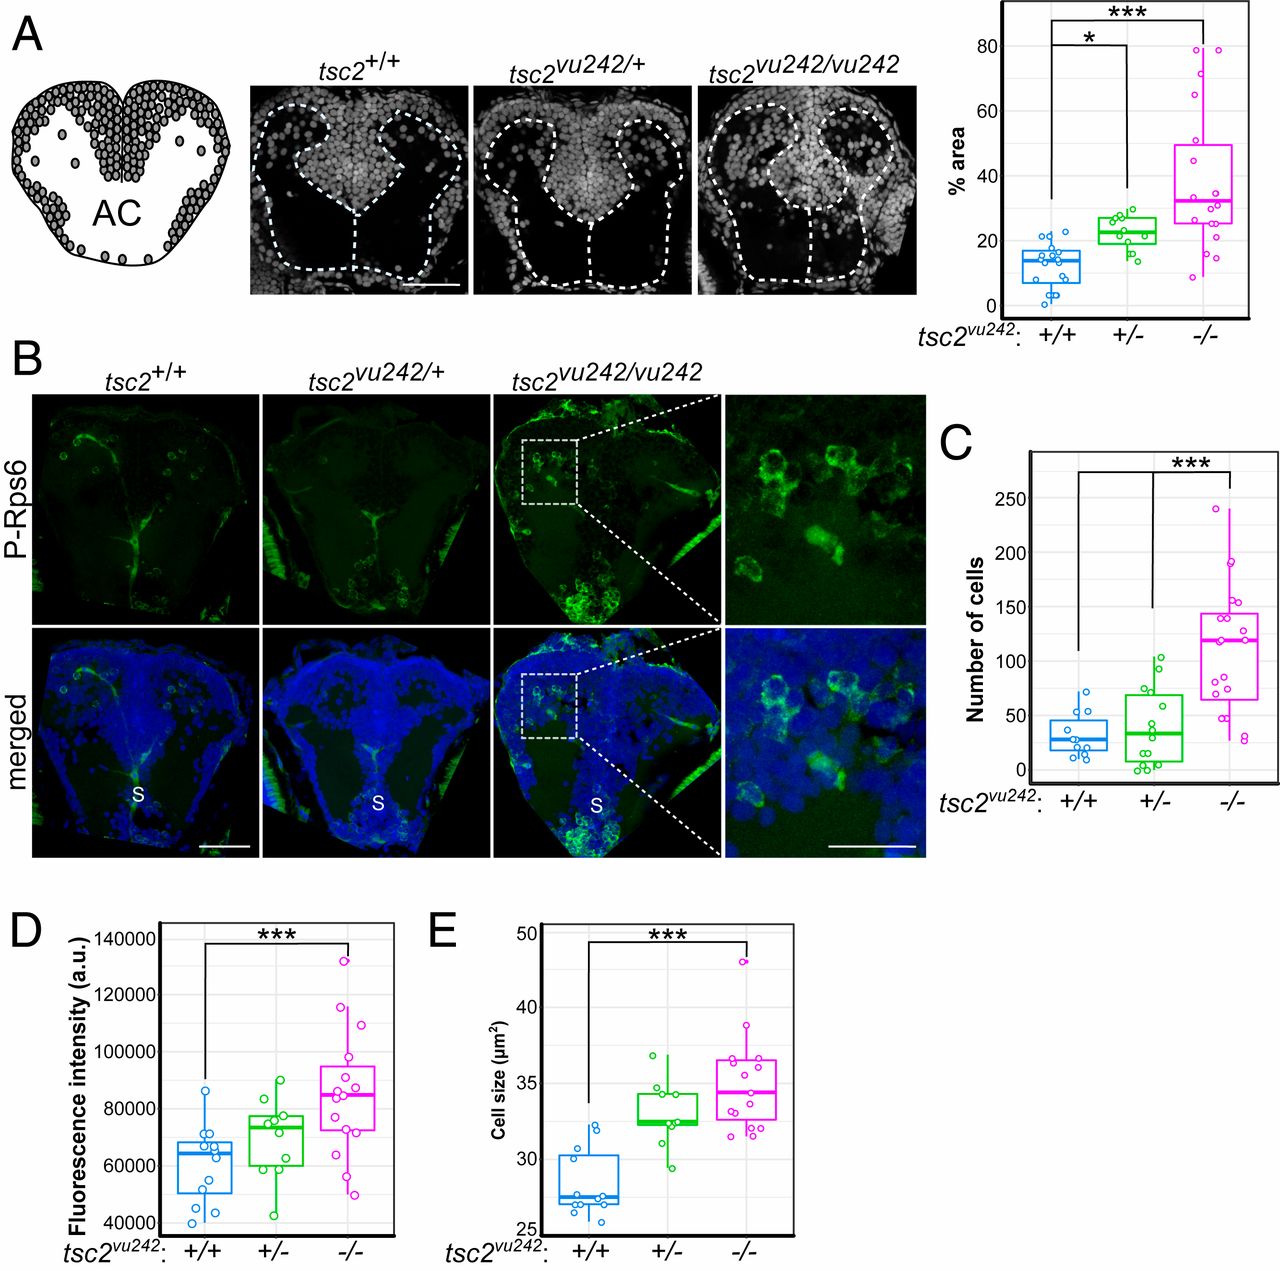
Fig. 1 tsc2vu242vu/242 exhibit WM disruption and mTorC1 activation in the pallium. (A) Organization of gray matter and WM in coronal section through the AC. Circles represent cell bodies. Sample photographs of tsc2vu242 brain sections that were stained with DAPI are shown, together with the relative number of cell bodies in WM compartments in tsc2vu242 brains [H = 24.443, P = 4.92 × 10⁻⁶; P = 3.1 × 10⁻⁶ for tsc2vu242/vu242 vs. tsc2+/+, P = 0.017 for tsc2vu242/+ vs. tsc2+/+ (Dunn’s test)]. (Scale bar, 40 μm.) (B) Representative images of coronal tsc2vu242 sections through the pallium that were immunostained with anti–P-Rps6 antibody (green). S, subpallium. [Scale bars, 40 and 20 μm (magnification).] (C) The number of P-Rps6–positive neurons in the telencephalon in tsc2vu242 [H = 18.88, P = 7.95 × 10⁻⁵; P = 0.00071 for tsc2vu242/vu242 vs. tsc2+/+, P = 0.00117 for tsc2vu242/vu242 vs. tsc2vu242/+ (Dunn’s test)]. (D) Mean phosphorylation levels of P-Rps6 per cell per fish in the telencephalon in tsc2vu242 [F = 6.772, P = 0.00335; P = 0.0019 for tsc2vu242/vu242 vs. tsc2+/+, P = 0.0696 for tsc2vu242/vu242 vs. tsc2vu242/+ (Dunnett’s test)]. (E) Mean soma size of P-Rps6–positive neurons per fish in the telencephalon in tsc2vu242 [F = 21.48, P = 9.3 × 10⁻⁷; P = 4.1 × 10⁻⁷ for tsc2vu242/vu242 vs. tsc2+/+, P = 0.133 for tsc2vu242/vu242 vs. tsc2vu242/+ (Dunnett’s test)]. *P < 0.05, ***P < 0.005.