
|
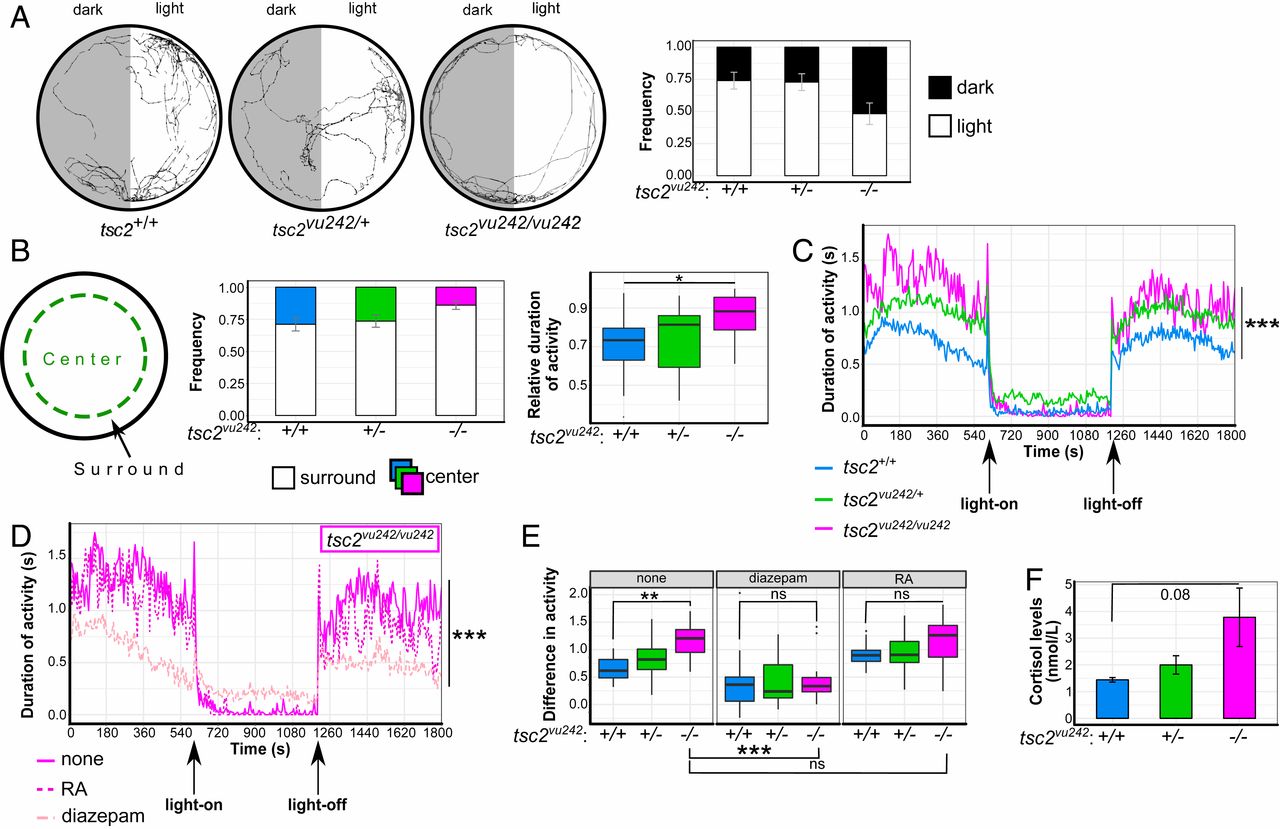
Fig. 4 Mutant tsc2vu242/vu242 exhibit an increase in anxiety-like behavior in the open field and in response to sudden changes in light conditions and an increase in cortisol levels. (A) Light-preference analysis of tsc2vu242 fish, including representative tracks and time spent in the light and dark compartments (relative to total activity) for each tsc2vu242 genotype [genotype × treatment: F = 8.181, P = 5 × 10⁻⁴; P = 1 × 10⁻⁴ for tsc2+/+ light vs. dark, P = 3 × 10⁻⁴ for tsc2vu242/+ light vs. dark, P = 0.999 for tsc2vu242/vu242 light vs. dark (Tukey HSD test); n = 15/genotype]. The data are expressed as mean ± SEM. (B) Schematic diagram of the open field analysis of tsc2vu242 fish that shows selections of the peripheral (surround) and central (center) areas of the experimental well, time spent in the peripheral and central areas of the well (relative to total activity) for each tsc2vu242 genotype (mean ± SEM), and data distribution of the time spent in the peripheral area relative to total activity of tsc2vu242 fish [F = 3.721, P = 0.0321; P = 0.043 for tsc2vu242/vu242 vs. tsc2+/+, P = 0.11 for tsc2vu242/vu242 vs. tsc2vu242/+ (Tukey HSD test); n = 15/genotype]. (C) Mean activity over time for each tsc2vu242 genotype after sudden changes in light conditions [H = 636.14, P < 2.2 × 10⁻¹⁶; P < 7.4 × 10⁻⁸ for tsc2vu242/vu242 vs. tsc2+/+ or tsc2vu242/+ (Dunn’s test); n = 23 tsc2vu242/vu242, n = 69 tsc2vu242/+, n = 45 tsc2+/+]. (D) Mean activity over time for tsc2vu242/vu242 that were subjected to sudden changes in light conditions after treatment with anxiety-modulating drugs compared with untreated fish [H = 492.92, P < 2.2 × 10⁻¹⁶; P < 2 × 10⁻¹⁶, untreated vs. treated (Dunn’s test)]. (E) Amplitudes of activity in the dark and light phases in tsc2vu242 fish after treatment with various anxiety-modulating drugs compared with untreated fish [genotype × treatment: F = 1.806, P = 0.128; treatment: F = 43.643, P < 2 × 10⁻¹⁶; P = 0.0067 for untreated tsc2vu242/vu242 vs. tsc2+/+; P = 1.3 × 10⁻⁵ for untreated tsc2vu242/vu242 vs. treated with diazepam; P = 0.999, untreated tsc2vu242/vu242 vs. treated with RA (Tukey HSD test)]. (F) Quantification of cortisol levels in tsc2vu242 fish [F = 3.395, P = 0.103; P = 0.081, tsc2vu242/vu242 vs. tsc2+/+ (Dunnett’s test); n = 120/genotype]. *P < 0.05, **P < 0.01, ***P < 0.005, ns: not significant.