FIGURE SUMMARY
Title

The role of clonal communication and heterogeneity in breast cancer

Authors
Martín-Pardillos, A., Valls Chiva, Á., Bande Vargas, G., Hurtado Blanco, P., Piñeiro Cid, R., Guijarro, P.J., Hümmer, S., Bejar Serrano, E., Rodriguez-Casanova, A., Diaz-Lagares, Á., Castellvi, J., Miravet-Verde, S., Serrano, L., Lluch-Senar, M., Sebastian, V., Bribian, A., López-Mascaraque, L., López-López, R., Ramón Y Cajal, S.
Source
Full text @ BMC Cancer

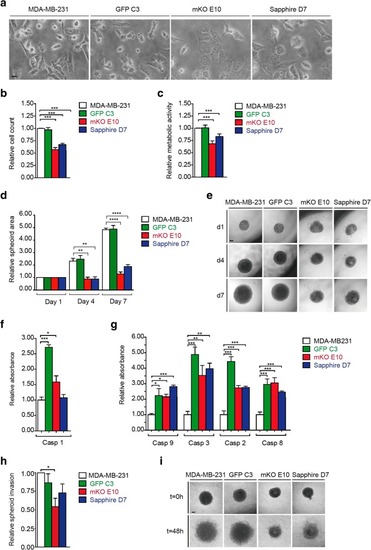
Phenotypic characterization of MDA-MB-231, GFP C3, mKO E10, and Sapphire D7 cell lines. a Morphological evaluation by phase contrast images (scale bar = 200 μm). b Cell count after 72 h in culture, relative to MDA-MB-231 count. c Metabolic activity rate: quantification of MTT metabolization by metabolically active cells, absorbance relative to MDA-MB-231. d-e 3D growth rate: spheroid area at days 1, 4 and 7, relative to MDA-MB-231-day 0 quantification (d) and representative pictures (scale bar = 250 μm) (e). f-g Apoptotic analysis: absorbance relative to MDA-MB231. Expression of Caspase 1 (f) and Caspase 9, 3, 2 and 8 (g). h-i 3D invasion by spheroid cell migration: relative invasion (h) and representative picture at 0 and 48 h (scale bar = 250 μm) (i). Significant differences were determined using unpaired t-test with Welch’s correction. Asterisks indicate significant differences when P-values are < 0.05 (*), < 0.01 (**), and < 0.001 (***)

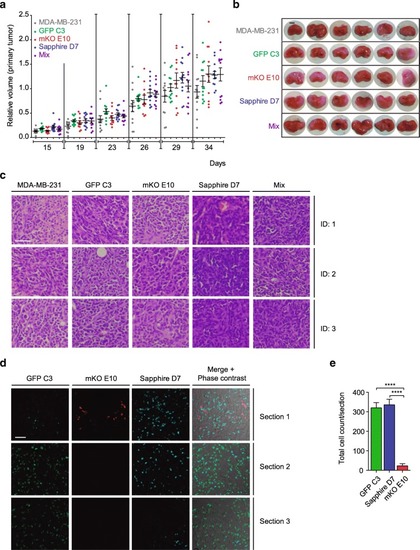
Malignancy of individual clones and tumor heterogeneity. a-c Tumor growth over 34 days after orthotopic injection of MDA-MB-231, GFP C3, mKO E10, or Sapphire D7 clonal cell lines and an equal mix of the previous cell lines (mix): (a) volume relative to MDA-MB-231 tumors (n = 12 per group), (b) macroscopic images of the tumors (scale bar = 0.5 cm) and (c) hematoxylin/eosin stains of tumor sections (scale bar = 50 μm) (three different animals per cell line: ID1, ID2, ID3). d-e Tumor heterogeneity: (d) representative fluorescent images (scale bar = 50 μm) of three independent sections of tumor formed by MDA-MB-231 parental and GFP C3, mKO E10 and Sapphire clonal cell lines (mix) and (e) quantification of tumor composition formed by the clonal cell lines (n = 6). Significant differences were determined using unpaired t-test with Welch’s correction. Asterisks indicate significant differences when P-values are < 0.05 (*), < 0.01 (**), and < 0.001 (***)

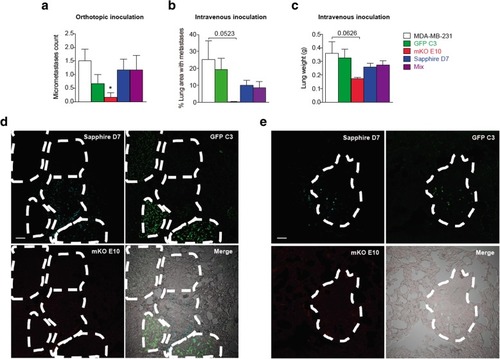
Metastatic capacity of cell lines and an equal mix of all cell lines. a Absolute count of micrometastases derived from orthotopic primary tumors, 34 days after injection of tumor cells. b-c Metastasis growth induced 35 days after intravenous injection of tumor cells: (b) lung area occupied by metastases, and (c) lung weight, an indirect measurement of lung tumors. Significant differences were determined using unpaired t-test with Welch’s correction. Asterisks indicate significant differences when P-values are < 0.05 (*), < 0.01 (**), and < 0.001 (***). d-e Representative fluorescent images (scale bar = 50 μm) of four independent sections of lung metastasis formed by MDA-MB-231 parental and GFP C3, mKO E10 and Sapphire clonal cell lines (mix)

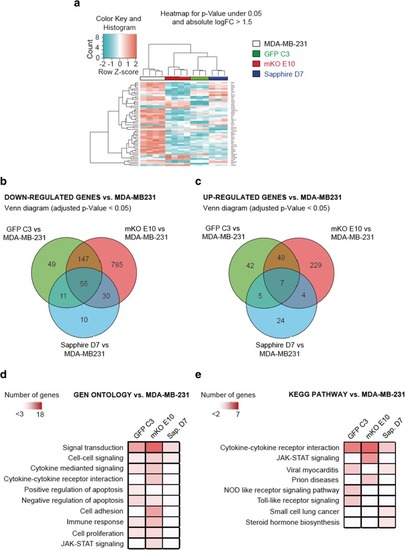
Transcriptional profile of MDA-MB-231 clonal cell lines. a Heatmap for P-value under 0.05 and absolute logFC> 1.5 of selected clonal cell lines. b-c Venn diagrams of downregulated (b) and upregulated (c) transcripts of selected clonal cell lines vs. MDA-MB-231. d Gene ontology (GO) with differentially expressed genes (logFC> 1 and FDR < 0.05) of each clonal cell line vs. MDA-MB-231 cell line. e KEGG with differentially expressed genes (logFC> 1 and FDR < 0.05) of each clonal cell line vs. MDA-MB-231 cell line

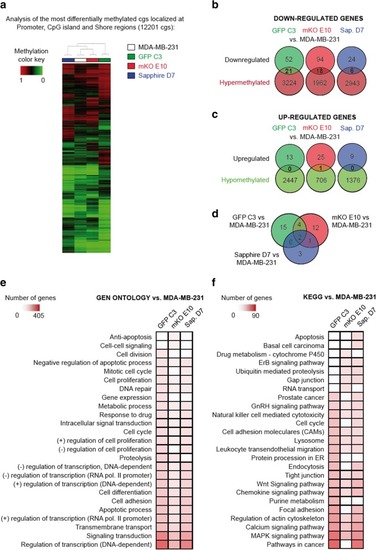
DNA methylation profile of MDA-MB-231 clonal cell lines. a Heatmap of the most differentially methylated CpGs (delta ≥0.20) localized at promoter, CpG island and shore regions (12,201 CpGs). b-c Identification of genes whose expression changes could be explained by methylation differences: (b) downregulated vs hypermethylated and (c) upregulated vs hypomethylated. d Venn diagrams of methylation gene changes of selected clonal cell lines vs. MDA-MB-231. e-f Gene Ontology (e) and KEGG (f) with differentially methylated genes (delta ≥0.20) at promoter and CpG island and shore

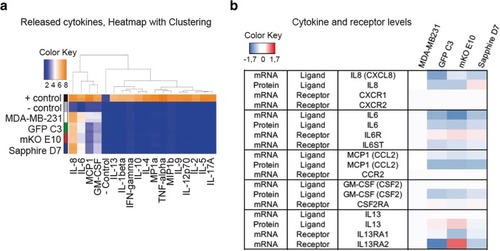
Cytokine expression. a Heatmap with clustering of released cytokines from the previous clonal cell lines. b Released cytokine mRNA and protein levels vs receptor levels

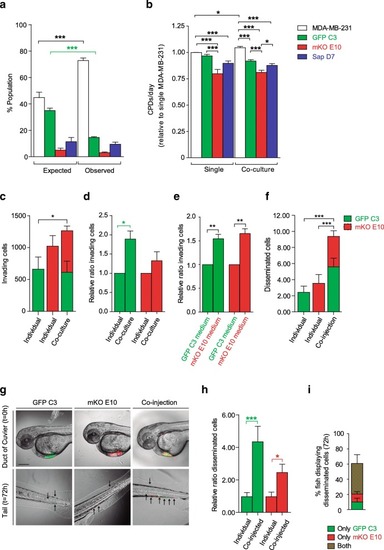
Clone interactions among parental and clonal cell lines in co-culture for 28 days (a-b). a Expected population percentage of total population calculated using cumulative population doublings (CPDs) per day vs. observed population percentage. b CPDs/day of single culture vs. CPDs/day of the same cell line in co-culture. c-e Cooperation of GFP C3 and mKO E10 in invasion assays: (c-d) Evaluation of cooperation on the invading capacity of single clones vs co-cultured clones: (c) Total number of invading cells and (d) Relative ratio of invading cells based on the cell number per clone cultured individually. (e) Invading capacity of cells conditioned with their own medium or medium from another clonal cell line. Relative ratio of invading cells based on the cell number per clone cultured with their own conditioned medium. (f-i) In vivo clonal cooperation. Cooperation of GFP C3 and mKO E10 in in vivo migration assays (Zebra fish model). Disseminated cells from the duct of Cuvier to the tail 72 h after injection: individual injection of GFP C3 and mKO E10 and co-injection of both clonal cell lines: (f) Total number of disseminated cells, (g) representative graph (scale bar = 70 μm), (h) relative ratio of invading cells based on the initial cell number per clone, (i) analysis of the coexistence of clones in the co-injected fish: percentage of co-injected fish with GFP C3 cells only, mKO E10 cells only, or both. Significant differences were determined using unpaired t-test with Welch’s correction. Asterisks indicate significant differences when P-values are < 0.05 (*), < 0.01 (**), and < 0.001 (***)

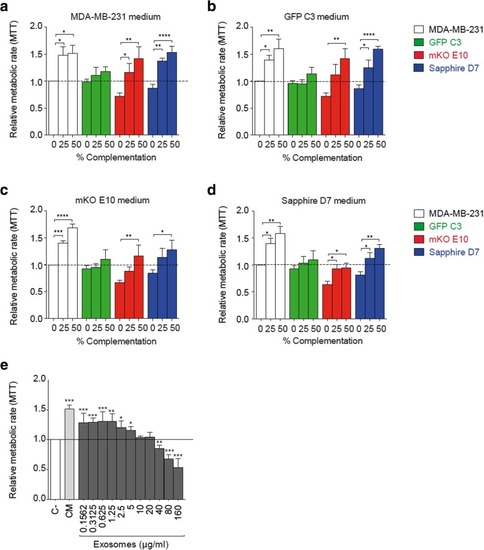
Clone communication by released soluble factors. a-d Metabolic activity by MTT assay of clonal cell lines, 72 h after medium complementation with supernatant extracted from MDA-MB-231, GFP C3, mKO E10 and Sapphire D7 cell line. Each graph corresponds to a cell line donor medium, (a) MDA-MB-231, (b) GFP C3, (c) mKO E10 and (d) Sapphire D7. Color bars indicate the receiving cell line. e Metabolic activity measurement of MDA-MB-231 by MTT assay after complementation with non-complemented medium (C-), 50% complemented medium (CM) and exosomes. Significant differences were determined using unpaired t-test with Welch’s correction. Asterisks indicate significant differences when P-values are < 0.05 (*), < 0.01 (**), and < 0.001 (***)

Acknowledgments
This image is the copyrighted work of the attributed author or publisher, and ZFIN has permission only to display this image to its users. Additional permissions should be obtained from the applicable author or publisher of the image. Full text @ BMC Cancer