IMAGE

Fig. 8

ID
ZDB-IMAGE-191230-135
Source
Figures for Martín-Pardillos et al., 2019
Image
Figure Caption

Fig. 8

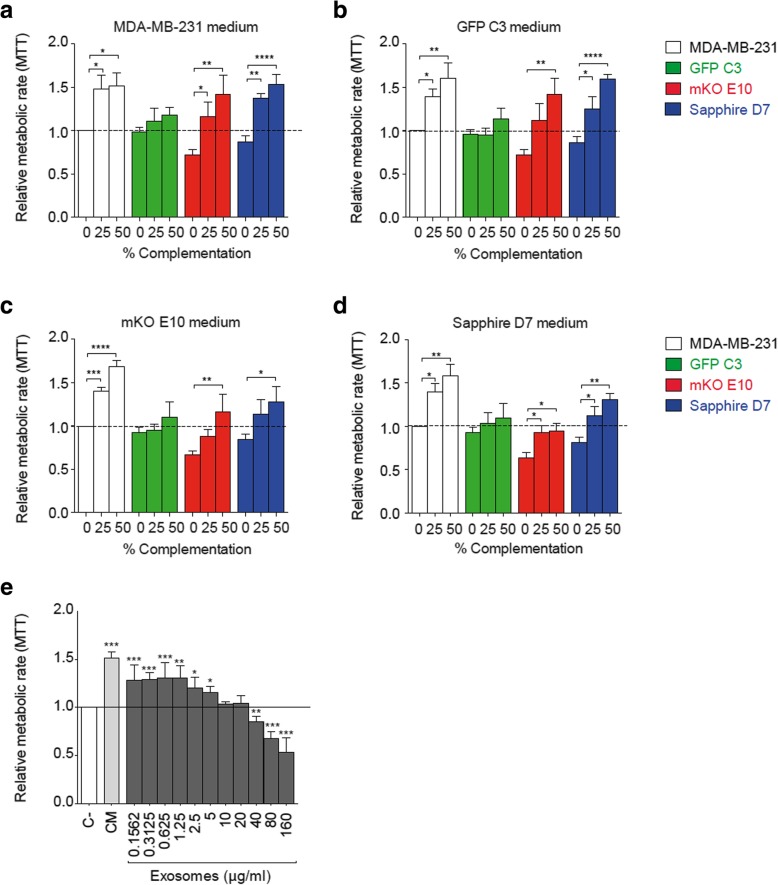
Clone communication by released soluble factors. a-d Metabolic activity by MTT assay of clonal cell lines, 72 h after medium complementation with supernatant extracted from MDA-MB-231, GFP C3, mKO E10 and Sapphire D7 cell line. Each graph corresponds to a cell line donor medium, (a) MDA-MB-231, (b) GFP C3, (c) mKO E10 and (d) Sapphire D7. Color bars indicate the receiving cell line. e Metabolic activity measurement of MDA-MB-231 by MTT assay after complementation with non-complemented medium (C-), 50% complemented medium (CM) and exosomes. Significant differences were determined using unpaired t-test with Welch’s correction. Asterisks indicate significant differences when P-values are < 0.05 (*), < 0.01 (**), and < 0.001 (***)

Acknowledgments
This image is the copyrighted work of the attributed author or publisher, and ZFIN has permission only to display this image to its users. Additional permissions should be obtained from the applicable author or publisher of the image. Full text @ BMC Cancer