FIGURE

Fig. 2

ID
ZDB-FIG-191230-102
Publication
Martín-Pardillos et al., 2019 - The role of clonal communication and heterogeneity in breast cancer
Other Figures
All Figure Page
Back to All Figure Page
Fig. 2

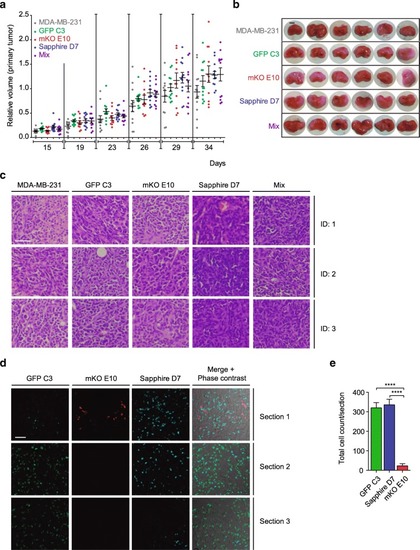
Malignancy of individual clones and tumor heterogeneity. a-c Tumor growth over 34 days after orthotopic injection of MDA-MB-231, GFP C3, mKO E10, or Sapphire D7 clonal cell lines and an equal mix of the previous cell lines (mix): (a) volume relative to MDA-MB-231 tumors (n = 12 per group), (b) macroscopic images of the tumors (scale bar = 0.5 cm) and (c) hematoxylin/eosin stains of tumor sections (scale bar = 50 μm) (three different animals per cell line: ID1, ID2, ID3). d-e Tumor heterogeneity: (d) representative fluorescent images (scale bar = 50 μm) of three independent sections of tumor formed by MDA-MB-231 parental and GFP C3, mKO E10 and Sapphire clonal cell lines (mix) and (e) quantification of tumor composition formed by the clonal cell lines (n = 6). Significant differences were determined using unpaired t-test with Welch’s correction. Asterisks indicate significant differences when P-values are < 0.05 (*), < 0.01 (**), and < 0.001 (***)

Expression Data

Expression Detail
Antibody Labeling
Phenotype Data

Phenotype Detail
Acknowledgments
This image is the copyrighted work of the attributed author or publisher, and ZFIN has permission only to display this image to its users. Additional permissions should be obtained from the applicable author or publisher of the image. Full text @ BMC Cancer