IMAGE

Fig. 1

ID
ZDB-IMAGE-191230-129
Source
Figures for Martín-Pardillos et al., 2019
Image
Figure Caption

Fig. 1

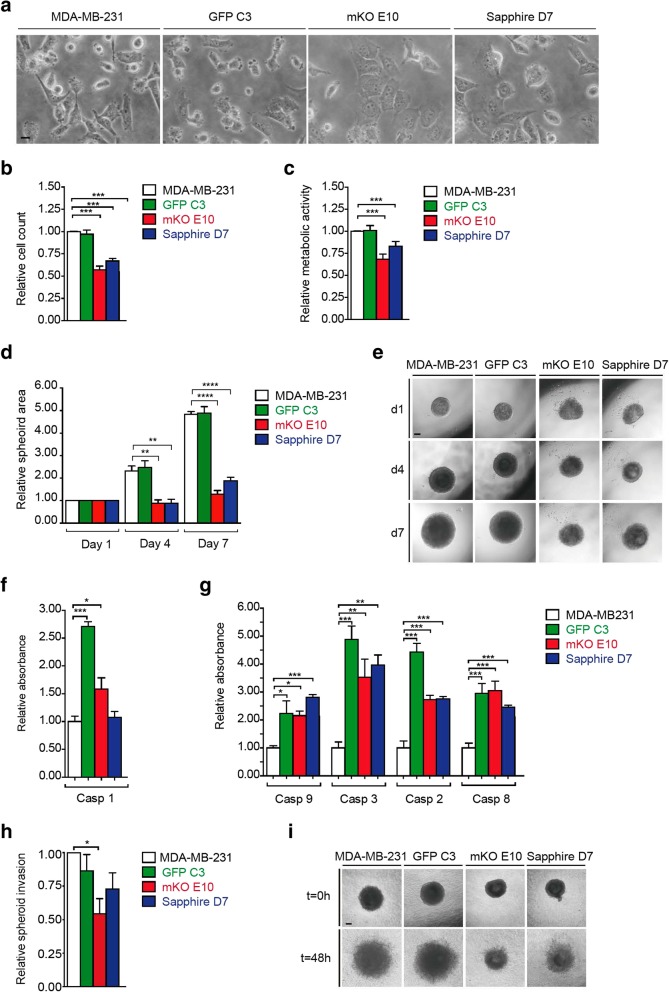
Phenotypic characterization of MDA-MB-231, GFP C3, mKO E10, and Sapphire D7 cell lines. a Morphological evaluation by phase contrast images (scale bar = 200 μm). b Cell count after 72 h in culture, relative to MDA-MB-231 count. c Metabolic activity rate: quantification of MTT metabolization by metabolically active cells, absorbance relative to MDA-MB-231. d-e 3D growth rate: spheroid area at days 1, 4 and 7, relative to MDA-MB-231-day 0 quantification (d) and representative pictures (scale bar = 250 μm) (e). f-g Apoptotic analysis: absorbance relative to MDA-MB231. Expression of Caspase 1 (f) and Caspase 9, 3, 2 and 8 (g). h-i 3D invasion by spheroid cell migration: relative invasion (h) and representative picture at 0 and 48 h (scale bar = 250 μm) (i). Significant differences were determined using unpaired t-test with Welch’s correction. Asterisks indicate significant differences when P-values are < 0.05 (*), < 0.01 (**), and < 0.001 (***)

Acknowledgments
This image is the copyrighted work of the attributed author or publisher, and ZFIN has permission only to display this image to its users. Additional permissions should be obtained from the applicable author or publisher of the image. Full text @ BMC Cancer