FIGURE SUMMARY
Title

Molecular Evolution of Tryptophan Hydroxylases in Vertebrates: A Comparative Genomic Survey

Authors
Xu, J., Li, Y., Lv, Y., Bian, C., You, X., Endoh, D., Teraoka, H., Shi, Q.
Source
Full text @ Genes (Basel)

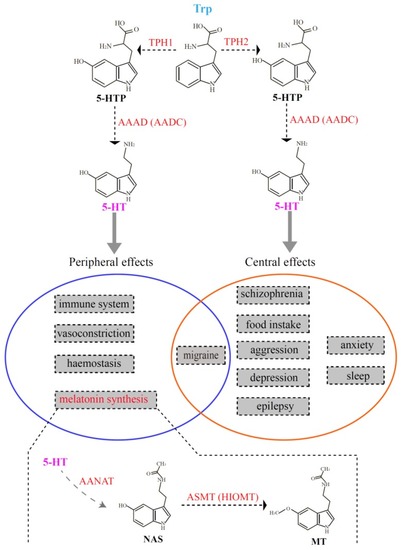
Schematic representation of the two serotonin systems in vertebrates. The top part denotes the process of serotonin biosynthesis, which is also the first two steps in melatonin synthesis. The middle part (in the circles) summarizes the functions regulated by the two serotonin systems. The bottom part interprets the last two steps for melatonin synthesis. 5-HT, 5-hydroxytryptamine; AAAD (AADC), l-aromatic amino acid decarboxylase; AANAT, aralkylamine N-acetyltransferase; ASMT, acetylserotonin-O-methyltransferase; HIOMT, hydroxyindole-O-mehyltransferase; MT, melatonin; NAS, N-acetylserotonin; TPH, tryptophan hydroxylase.

Phylogenetic trees and genome synteny of tph1 and tph2 in vertebrates. (a) The phylogenetic tree was generated from 105 TPH1 protein sequences (the left part), and the synteny data of tph1 (the right part) are presented for confirmation. (b) The phylogenetic tree was generated from 79 TPH2 protein sequences (the left part), and the synteny data of tph2 (the right part) are presented for validation. Numbers on the branches from left to right are bootstrap values generated in the PhyML reconstruction and the Bayesian posterior probabilities obtained in the Bayesian inference, respectively. The bootstrap values under 60% and posterior probabilities less than 0.65 are not shown.

Phylogenetic trees and genome synteny of tph1 and tph2 in vertebrates. (a) The phylogenetic tree was generated from 105 TPH1 protein sequences (the left part), and the synteny data of tph1 (the right part) are presented for confirmation. (b) The phylogenetic tree was generated from 79 TPH2 protein sequences (the left part), and the synteny data of tph2 (the right part) are presented for validation. Numbers on the branches from left to right are bootstrap values generated in the PhyML reconstruction and the Bayesian posterior probabilities obtained in the Bayesian inference, respectively. The bootstrap values under 60% and posterior probabilities less than 0.65 are not shown.

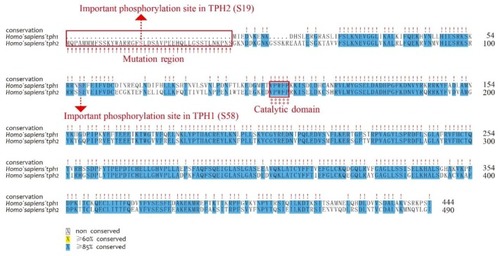
Alignment of human TPH1 and TPH2 protein sequences. Important residues include the mutation region (in the NH2-terminal red box), phosphorylation sites (dashed lines with red arrows), and catalytic domains (‡ with the red box).

Alignment and secondary structures of TPH protein sequences in vertebrates. (a) TPH2 protein sequences from representative vertebrate species were aligned with the human TPH2 and its secondary structure template 4V06. (b) Sequence alignment between TPH1a and TPH1b in some representative teleosts is provided for comparison. (c) TPH1 protein sequences from representative vertebrates were aligned with the human TPH1 and its secondary structure template 5L01. The mutation regions are marked with rose boxes and upper arrows in each figure. The red boxes denote the phosphorylation sites based on the human templates. Related alignment and secondary structures in more vertebrate species are provided in Figure S2.

Alignment and secondary structures of TPH protein sequences in vertebrates. (a) TPH2 protein sequences from representative vertebrate species were aligned with the human TPH2 and its secondary structure template 4V06. (b) Sequence alignment between TPH1a and TPH1b in some representative teleosts is provided for comparison. (c) TPH1 protein sequences from representative vertebrates were aligned with the human TPH1 and its secondary structure template 5L01. The mutation regions are marked with rose boxes and upper arrows in each figure. The red boxes denote the phosphorylation sites based on the human templates. Related alignment and secondary structures in more vertebrate species are provided in Figure S2.

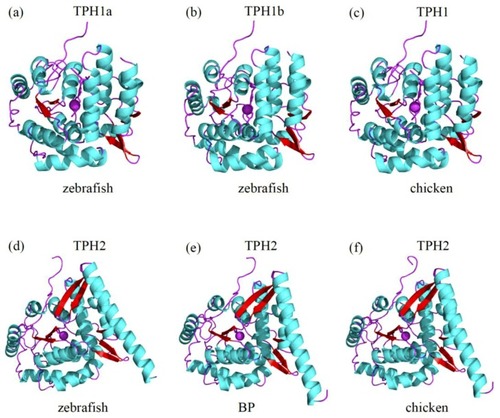
Predicted 3D structures of representative TPH proteins. Comparisons of the 3D structures of zebrafish TPH1a (a), zebrafish TPH1b (b), chicken TPH1 (c), zebrafish TPH2 (d), BP TPH2 (e), and chicken TPH2 (f) are illuminated in Section 3.5. Helices of the catalytic domains and β-strands are colored sky blue and red, respectively. Loop regions are marked in purple.

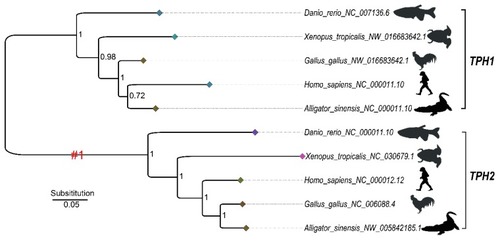
The Bayesian inference (BI) tree based on five TPH1 and TPH2 proteins selected from those shown in Figure S1 to represent the five major groups of vertebrates for selection pressure analysis. #1 denotes the foreground of the TPH2 clade. Numbers in the topology indicate the Bayesian posterior probabilities. The diamonds at the tips of each branch are colored based on the branch length, with a darker color representing a shorter evolutionary branch.

Alignment of the datasets for selection pressure analysis. The five positively selected sites predicted by the branch-site model test are marked with red boxes and emphasized with section marks (§).

Acknowledgments
This image is the copyrighted work of the attributed author or publisher, and ZFIN has permission only to display this image to its users. Additional permissions should be obtained from the applicable author or publisher of the image. Full text @ Genes (Basel)