
FIGURE
Figure 3
Figure 3
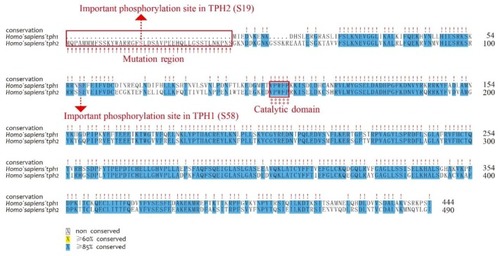
Alignment of human TPH1 and TPH2 protein sequences. Important residues include the mutation region (in the NH2-terminal red box), phosphorylation sites (dashed lines with red arrows), and catalytic domains (‡ with the red box). |
Expression Data
Expression Detail
Antibody Labeling
Phenotype Data
Phenotype Detail
Acknowledgments
This image is the copyrighted work of the attributed author or publisher, and
ZFIN has permission only to display this image to its users.
Additional permissions should be obtained from the applicable author or publisher of the image.
Full text @ Genes (Basel)