FIGURE

Figure 6

ID
ZDB-FIG-191230-1908
Publication
Xu et al., 2019 - Molecular Evolution of Tryptophan Hydroxylases in Vertebrates: A Comparative Genomic Survey
Other Figures
All Figure Page
Back to All Figure Page
Figure 6

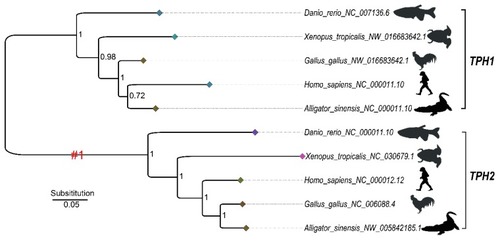
The Bayesian inference (BI) tree based on five TPH1 and TPH2 proteins selected from those shown in Figure S1 to represent the five major groups of vertebrates for selection pressure analysis. #1 denotes the foreground of the TPH2 clade. Numbers in the topology indicate the Bayesian posterior probabilities. The diamonds at the tips of each branch are colored based on the branch length, with a darker color representing a shorter evolutionary branch.

Expression Data

Expression Detail
Antibody Labeling
Phenotype Data

Phenotype Detail
Acknowledgments
This image is the copyrighted work of the attributed author or publisher, and ZFIN has permission only to display this image to its users. Additional permissions should be obtained from the applicable author or publisher of the image. Full text @ Genes (Basel)