IMAGE

Figure 2

ID
ZDB-IMAGE-191230-1876
Source
Figures for Xu et al., 2019
Image
Figure Caption

Figure 2

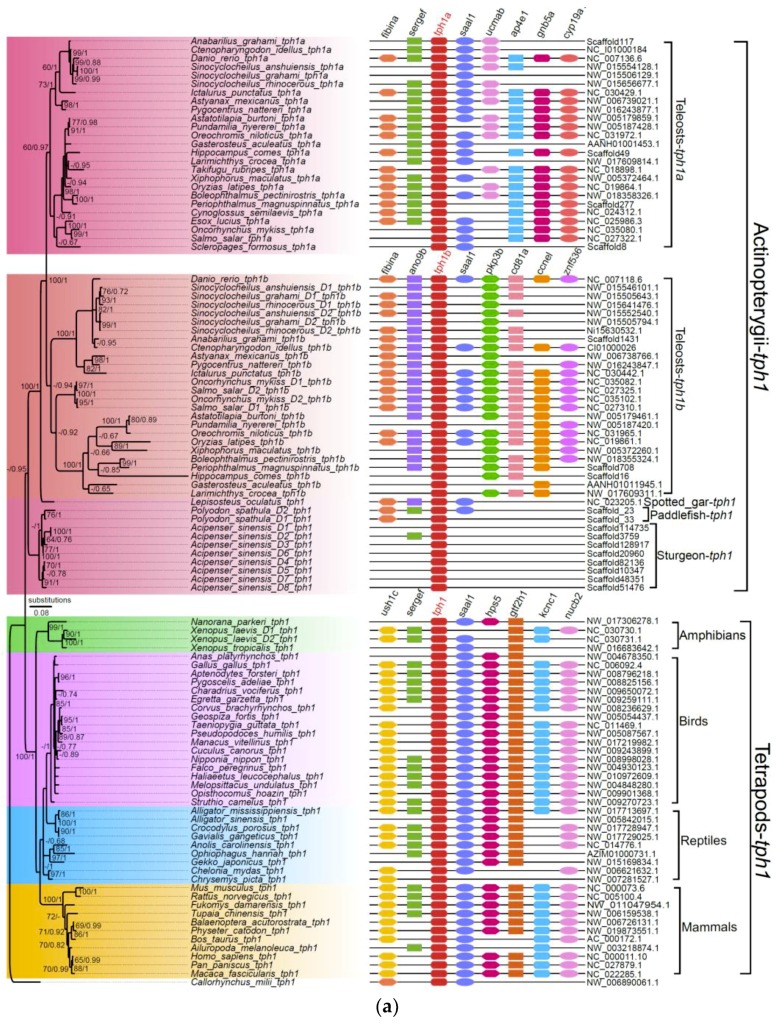
Phylogenetic trees and genome synteny of tph1 and tph2 in vertebrates. (a) The phylogenetic tree was generated from 105 TPH1 protein sequences (the left part), and the synteny data of tph1 (the right part) are presented for confirmation. (b) The phylogenetic tree was generated from 79 TPH2 protein sequences (the left part), and the synteny data of tph2 (the right part) are presented for validation. Numbers on the branches from left to right are bootstrap values generated in the PhyML reconstruction and the Bayesian posterior probabilities obtained in the Bayesian inference, respectively. The bootstrap values under 60% and posterior probabilities less than 0.65 are not shown.

Acknowledgments
This image is the copyrighted work of the attributed author or publisher, and ZFIN has permission only to display this image to its users. Additional permissions should be obtained from the applicable author or publisher of the image. Full text @ Genes (Basel)