
- Title
-
Evolutionary transition from degenerate to nonredundant cytokine signaling networks supporting intrathymic T cell development
- Authors
- Lawir, D.F., Hess, I., Sikora, K., Iwanami, N., Siamishi, I., Schorpp, M., Boehm, T.
- Source
- Full text @ Proc. Natl. Acad. Sci. USA

Characterization of the zebrafish il7 gene (ENSEMBL ID: ENSDARG00000092045). (A) RNA in situ hybridization on tissue sections of adult zebrafish thymus with probes specific for rag1 and il7. (B) RNA in situ hybridization on tissue sections of adult zebrafish kidney with a probe specific for il7. (C) Reduced thymopoietic activity in il7 morphants as determined by the thymopoietic index (Left), derived from quantitative analysis of whole-mount RNA in situ hybridization experiments (Right). Each data point represents 1 fish; data are mean ± SEM. (D) RT-PCR analysis of il7 cDNA structures resulting from interference with splicing of the pre-mRNA transcripts by an antisense oligonucleotide targeting the splice donor site of exon 4 (SD4). The deletion in variant a does not cause a frame shift, since all exons of the il7 gene are in phase 0; the use of cryptic splice site in the intron between exons 4 and 5 causes a frame shift mutation. (E) Schematic of the il7 gene structure, indicating the deletion introduced by CRISPR/Cas9 mutagenesis. (F) Sequence analysis of cDNAs demonstrating the loss of sequences derived from exons 2 to 4 in transcripts emanating from the il7#17A mutant allele. |

Characterization of il7 mutant zebrafish. (A) Normal gross appearance of adult wild-type (il7+/+) and mutant (il7−/−) fish. (B) Reduced number of ikaros-expressing lymphocytes in the thymus of il7-mutant fish also transgenic for an ikaros:eGFP reporter allele. (Left) Representative animals at 72 hpf. (Right) Quantitative assessment of cell numbers in the thymic rudiment. (C) Reduced thymopoietic activity in il7 mutants as determined by the thymopoietic index (Left) derived from quantitative analysis of whole- mount RNA in situ hybridization experiments (Right). Each data point represents 1 fish; data are mean ± SEM. (D, Left) Flow cytometry analysis of GFP-positive cells present in the thymus of wild-type and il7 mutant fish at age 2 mo. (D, Right) Enumeration of the total number of GFP-positive cells in the thymus at age 2 and 3 mo. Each data point represents 1 fish; data are mean ± SEM. (E) Enumeration of the total number of GFP-positive cells with light-scatter characteristics of lymphocytes (encircled; age 2 mo) (Left) in the thymus at age 2 and 3 mo (Right). Each data point represents 1 fish; data are mean ± SEM. A comparison of the data in D and E indicates that the majority of GFP-positive cells in the thymus are lymphocytes. (F) Normal histology of il7 mutant thymus in adult fish. (G–J) RNA in situ hybridization on tissue sections of adult wild-type and il7 mutant zebrafish thymus with probes specific for foxn1 (G), expressed by thymic epithelial cells; rag1 (H), indicative of immature thymocytes; tcr beta (I), indicative of αβ T cells; and tcr delta (J), indicative of γδ T cells. EXPRESSION / LABELING:
PHENOTYPE:
|
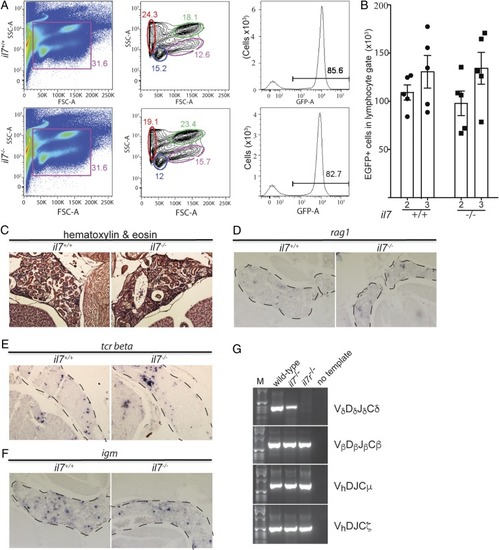
Characterization of hematopoiesis in 3-mo-old zebrafish kidneys. (A) Flow cytometry analysis of cell populations in whole kidney marrow of adult wild-type and il7-mutant fish (Left and Middle). The different cell populations as identified by the characteristic light-scatter characteristics are indicated (red, erythrocytes; blue, lymphocytes; green, myeloid cells; pink, precursor cells) (34). The majority of cells in the lymphocyte gate (blue) are GFP-positive (Right). (B) Enumeration of GFP-positive cells in the lymphocyte gate of wild-type and il7-mutant fish at age 2 and 3 mo. Each data point represents 1 fish; data are mean ± SEM. (C) Normal histology of kidney marrow in il7 mutant adult fish. (D–F) RNA in situ hybridization on tissue sections of adult wild-type and il7 mutant kidney marrow (outlined with dashed lines) with probes specific for rag1 (D), indicative of B cell precursors; tcr beta (E), indicative of αβ T cells; and igm (F), indicative of Β cells. (G) RT-PCR assay for expressed completely assembled antigen receptor genes. Vd-Dd-Jd-Cd assemblies associated with the γδ T cell lineage are present in the whole kidney marrow of il7 mutants but not in that of il7r mutants; assemblies of other lineage-specific antigen receptors are present in both mutant fish lines (Vb-Db-Jb-Cb for αβ T cells, Vh-D-J-Cm for Igμ-expressing B cells, and Vh-D-J-Cz for Igζ-expressing B cells). Representative panels are shown for wild-type fish (n = 5), il7 mutants (n = 4), and il7r mutants (n = 5). |

Epistasis analysis of the il7 mutation. (A) Thymopoietic capacities measured in fish of the 9 genotypes arising from an intercross of il7+/−;il7r+/− double-heterozygous parents. Each data point represents 1 fish; data are mean ± SEM. Representative whole-mount RNA in situ hybridization results for the key genotypes are shown at the bottom. (B) Comparison of phenotypes of the 2 single mutants (il7−/− and il7r−/−) and the il7−/−;il7r−/− double mutant; the latter phenotype is compared with the expected phenotype (multiplicative model). The thymopoietic capacity observed in the double mutant is significantly higher than that expected from the combination of the single mutants, calculated under the assumption of no genetic interaction, indicative of alleviating genetic interaction. (C) Thymopoietic capacities measured in fish of the 9 genotypes arising from an intercross of il7+/−;/jak3+/− double-heterozygous parents. Each data point represents 1 fish; data are mean ± SEM. Representative whole-mount RNA in situ hybridization results for the key genotypes are shown at the bottom. (D) Comparison of phenotypes of the 2 single mutants (il7−/− and jak3−/−) and the il7−/−;jak3−/− double mutant with the expected phenotype. The observed thymopoietic capacity observed in the double mutant is significantly higher than that expected from the combination of the single mutants, indicative of alleviating genetic interaction. (E) Thymopoietic capacities measured in crlf2 morphants of 3 different il7 genotypes. Representative whole-mount RNA in situ hybridization results are shown at the right. (F) The degree of reduction of thymopoietic activity in the presence of the crlf2 antisense oligonucleotide is independent of il7 genotype, indicating that the 2 effects are genetically independent (no genetic interaction). (G) RT-PCR analysis of crlf2 cDNA structures resulting from interference with splicing of the pre-mRNA transcripts by an antisense oligonucleotide targeting the splice donor site of exon 3 (SD3). |
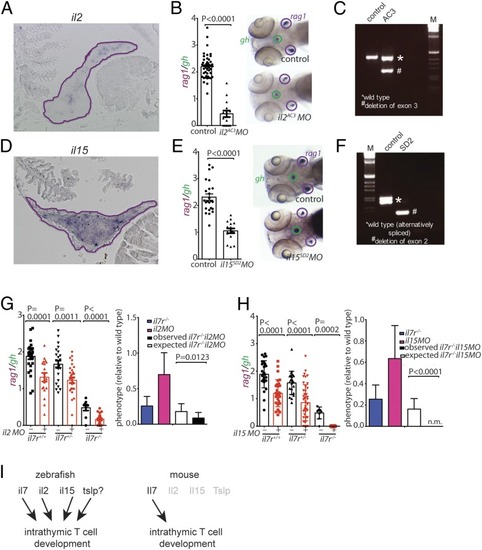
Characterization of cytokine gene morphants. (A) RNA in situ hybridization on tissue sections of adult zebrafish thymus with probes specific for il2; the positive cells appear to cluster in certain regions of the thymus. (B) Reduced thymopoietic activity in il2 morphants as determined by the thymopoietic index (Left), derived from quantitative analysis of whole-mount RNA in situ hybridization experiments (Right). Each data point represents 1 fish; data are mean ± SEM. (C) RT-PCR analysis of il2 cDNA structures resulting from interference with splicing of the pre-mRNA transcripts by an antisense oligonucleotide targeting the splice acceptor site of exon 3 (AC3). (D) RNA in situ hybridization on tissue sections of adult zebrafish thymus with probes specific for il15. (E) Reduced thymopoietic activity in il15 morphants as determined by the thymopoietic index (Left), derived from quantitative analysis of whole-mount RNA in situ hybridization experiments (Right). Each data point represents 1 fish; data are mean ± SEM. (F) RT-PCR analysis of il15 cDNA structures resulting from interference with splicing of the pre-mRNA transcripts by an antisense oligonucleotide targeting the splice donor site of exon 2 (AC3). (G, Left) Thymopoietic capacities measured in il2 morphants of 3 different il7r genotypes. Each data point represents 1 fish; data are mean ± SEM. (G, Right) The degree of thymopoietic activity in the presence of the il2 antisense oligonucleotide is significantly lower than expected from neutrality, indicating the presence of synthetic genetic interaction between il2 and il7r. (H, Left) Thymopoietic capacities measured in il15 morphants of 3 different il7r genotypes. Each data point represents 1 fish; data are mean ± SEM. (H, Right) The degree of thymopoietic activity in the presence of the il15 antisense oligonucleotide is significantly lower than that expected from neutrality (n.m. denotes the absence of detectable rag1 signal in the double-mutant fish), indicating the presence of a synthetic genetic interaction between il15 and il7r. (I) Schematic representation of the degenerate cytokine network regulating intrathymic T cell development in zebrafish (Left) and the corresponding nonredundant network structure in mouse (Right). |