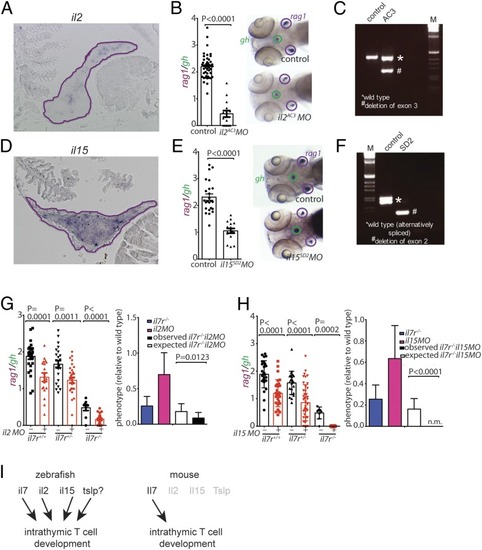
Characterization of cytokine gene morphants. (A) RNA in situ hybridization on tissue sections of adult zebrafish thymus with probes specific for il2; the positive cells appear to cluster in certain regions of the thymus. (B) Reduced thymopoietic activity in il2 morphants as determined by the thymopoietic index (Left), derived from quantitative analysis of whole-mount RNA in situ hybridization experiments (Right). Each data point represents 1 fish; data are mean ± SEM. (C) RT-PCR analysis of il2 cDNA structures resulting from interference with splicing of the pre-mRNA transcripts by an antisense oligonucleotide targeting the splice acceptor site of exon 3 (AC3). (D) RNA in situ hybridization on tissue sections of adult zebrafish thymus with probes specific for il15. (E) Reduced thymopoietic activity in il15 morphants as determined by the thymopoietic index (Left), derived from quantitative analysis of whole-mount RNA in situ hybridization experiments (Right). Each data point represents 1 fish; data are mean ± SEM. (F) RT-PCR analysis of il15 cDNA structures resulting from interference with splicing of the pre-mRNA transcripts by an antisense oligonucleotide targeting the splice donor site of exon 2 (AC3). (G, Left) Thymopoietic capacities measured in il2 morphants of 3 different il7r genotypes. Each data point represents 1 fish; data are mean ± SEM. (G, Right) The degree of thymopoietic activity in the presence of the il2 antisense oligonucleotide is significantly lower than expected from neutrality, indicating the presence of synthetic genetic interaction between il2 and il7r. (H, Left) Thymopoietic capacities measured in il15 morphants of 3 different il7r genotypes. Each data point represents 1 fish; data are mean ± SEM. (H, Right) The degree of thymopoietic activity in the presence of the il15 antisense oligonucleotide is significantly lower than that expected from neutrality (n.m. denotes the absence of detectable rag1 signal in the double-mutant fish), indicating the presence of a synthetic genetic interaction between il15 and il7r. (I) Schematic representation of the degenerate cytokine network regulating intrathymic T cell development in zebrafish (Left) and the corresponding nonredundant network structure in mouse (Right).
|
