
- Title
-
Cell Type Purification by Single-Cell Transcriptome-Trained Sorting
- Authors
- Baron, C.S., Barve, A., Muraro, M.J., van der Linden, R., Dharmadhikari, G., Lyubimova, A., de Koning, E.J.P., van Oudenaarden, A.
- Source
- Full text @ Cell

GateID Workflow In step 1, the GateID TD is generated. (A) Live single cells from the organ of interest are sorted in an unbiased manner, and index data for all available channels are recorded. (B) Single cells sorted in (A) are sequenced to determine the cell type composition of the organ. (C) The TD is generated after merging the FACS index data and the cell type information for each single cell. In step 2, the gates are computationally designed for the desired cell type. (D) Gates are computed for each possible combination of channels. (E) The best combination of gates is chosen to maximize the yield and purity of the desired cell type. In step 3, GateID-predicted gates are tested experimentally. (F) The predicted gates are normalized to the new experimental dataset. (G) Single cells in GateID gates are sorted. (H) After scRNA-seq, cell types present in the GateID-enriched library are determined, and the experimental purity is calculated by comparison with the unenriched library. See also |

Proof of Principle: Enrichment of Zebrafish Eosinophils Using GateID (A) GateID-predicted gates to isolate eosinophils from unstained WKM on BD FACSJazz. Gates were predicted on unstained WKM TD1. Red points show desired cells (eosinophils) present in TD1, and blue points show undesired cells present in the other gate. A blue undesired cell in a gate denotes an impure cell that will be sorted. (B) Contour plots of unstained WKM cells showing experimental sorting gates for eosinophils for the WKM 2 experiment (representative example for WKM 1–3 eosinophil enrichment experiments) on BD FACSJazz. Gates in black represent GateID-predicted gates prior to normalization, whereas red gates show GateID-normalized sorting gates. Sorted cells passed through normalized gate 1 and gate 2. Percentages of events within each gate are indicated. (C) t-SNE map of the complete zebrafish WKM dataset (all WKM TDs and enrichment experiment datasets of this study, n = 15,984 cells). Single cells are colored based on cell type. (D) Barplots and t-SNE maps showing the outcome of GateID eosinophil enrichments for three independent experiments (WKM 1–3) on BD FACSJazz. Gates were predicted on unstained TD1. In the barplots, numbers within the bars indicate the percentage of eosinophils in the corresponding library, and numbers above the bars indicate the cell type fold enrichment between the unenriched and GateID enriched library. On the t-SNE maps, gray points represent all cells from the WKM dataset. For each experiment, black dots represent single cells in the unenriched library for a given experiment, whereas colored dots represent single cells in the GateID-enriched library for the same experiment. (E) Left panel: principal-component analysis (PCA) of zebrafish WKM TD1 (unstained, BD FACSJazz). Each point represents a single cell, and single cells are colored based on cell type identification from scRNA-seq. The ellipses represent normal contour lines that contain 50% of the data points for each cell type. Right panel: PC1 and PC2 loadings. Each point represents a FACS channel measured by the BD FACSJazz. (F) Curves showing the trade-off between yield and purity of GateID solutions for HSPCs, lymphocytes, monocytes, and eosinophils on stained (solid line) and unstained (dashed line) cells from the same zebrafish WKM (WKM 7). See also |

General Dyes Enhance Hematopoietic Cell Type Segregation in FACS Space to Allow HSPC Purification with GateID (A) Left panel: PCA of zebrafish WKM TD2 (stained, BD FACSJazz). Each point represents a single cell, and single cells are colored based on cell type identification from scRNA-seq. The ellipses represent normal contour lines that contain 50% of the data points for each cell type. Right panel: PC1 and PC2 loadings. Each point represents a FACS channel measured by the BD FACSJazz. (B) Barplots and t-SNE map showing the outcome of GateID enrichments of eosinophils (WKM 4) on BD FACSJazz. Gates were predicted on stained TD2. (C) Contour plots of stained WKM cells showing experimental sorting gates for HSPCs for the WKM 10 experiment (representative example for WKM 5, 10, and 15 HSPC enrichment experiments) on BD FACSJazz. Sorted cells passed through gate 1 and gate 2. Percentages of events within each gate are indicated. (D) Projection of the sorted GateID HSPCs for WKM 10 in FSC height versus SSC height (representative example for WKM 5, 10, and 15 HSPC enrichment experiments). (E) t-SNE map of zebrafish WKM TD2, where HSPCs inside and outside of GateID gates are colored red and blue, respectively. (F–H) Barplots and t-SNE maps showing the outcome of HSPC enrichments for (F) WKM 5, (G) WKM 10, and (H) WKM 15 on BD FACSJazz. See also |
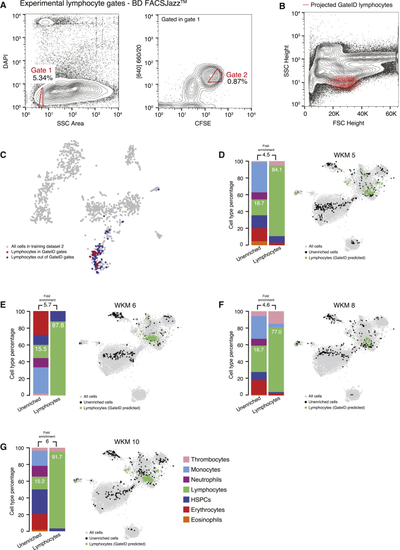
GateID Allows Purification of Zebrafish Lymphocytes (A) Contour plots of stained WKM cells showing experimental sorting gates for lymphocytes for the WKM 10 experiment (representative example for WKM 5, 6, 8, and 10 lymphocyte enrichment experiments) on BD FACSJazz. Sorted cells passed through gate 1 and gate 2. Percentages of events within each gate are indicated. (B) Projection of the sorted GateID lymphocytes for WKM10 in FSC height versus SSC height (representative example for WKM 5, 6, 8, and 10 lymphocyte enrichment experiments). (C) t-SNE map of zebrafish WKM TD2 where lymphocytes inside and outside of GateID gates are colored red and blue, respectively. (D–G) Barplots and t-SNE maps showing the outcome of lymphocyte enrichments for (D) WKM 5, (E) WKM 6, (F) WKM 8, and (G) WKM 10 on BD FACSJazz. See also |
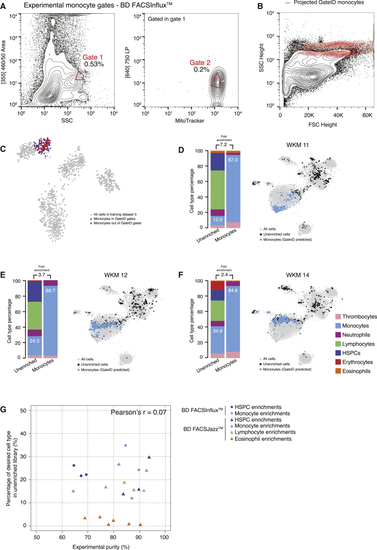
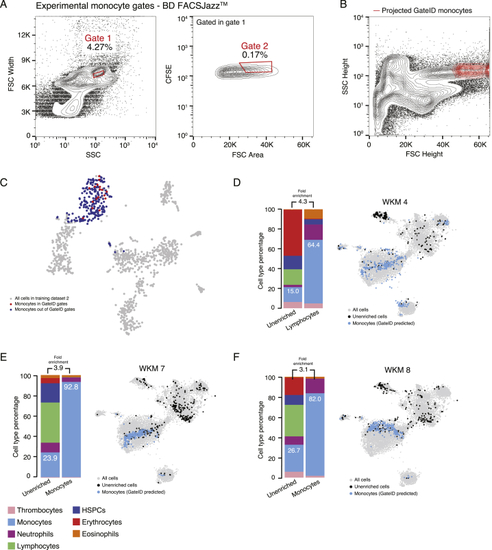
GateID Allows Purification of Zebrafish Monocytes (A) Contour plots of stained WKM cells, showing experimental sorting gates for monocytes for the WKM 11 experiment (representative example for WKM 11, 12, and 14 monocyte enrichment experiments) on BD FACSInflux. Sorted cells passed through gate 1 and gate 2. Percentages of events within each gate are indicated. (B) Projection of the sorted GateID monocytes for WKM 11 in FSC height versus SSC height (representative example for WKM 11, 12, and 14 monocyte enrichment experiments). (C) t-SNE map of zebrafish WKM TD3, where monocytes inside and outside of GateID gates are colored red and blue, respectively. (D–F) Barplots and t-SNE maps showing the outcome of monocyte enrichments for (D) WKM 11, (E) WKM 12, and (F) WKM 14 on BD FACSInflux. (G) Scatterplot showing the percentage of the desired cell type in the unenriched library versus the achieved GateID purity in the enriched library for all WKM enrichment experiments. Points are colored based on the cell type enriched (orange for eosinophils, dark blue for HSPCs, light blue for monocytes, and green for lymphocytes) and shaped based on the FACS machine used for isolation (triangles for BD FACSJazz and circles for BD FACSInflux). See also |

GateID Allows Enrichment of α and β Cells from Human Pancreatic Islets (A) t-SNE map of the complete pancreas dataset (all pancreas TDs and unstained enrichment experiment datasets, n = 10,176 cells). Single cells are colored based on cell type. (B) Left panel: PCA of human pancreas TD2 (unstained, BD FACSJazz). Each point represents a single cell, and single cells are colored based on cell type identification from scRNA-seq. The ellipses represent normal contour lines that contain 50% of the data points for each cell type. Right panel: PC1 and PC2 loadings. Each point represents a FACS channel measured by the BD FACSJazz. (C) Contour plots of unstained human pancreas cells showing experimental gates used to sort α cells from donor 4. Sorted cells passed through gate 1 and gate 2. Percentages of events within each gate are indicated. (D) t-SNE map of human pancreas TD2, where α cells inside and outside of GateID gates are colored red and blue, respectively. (E) Contour plots of unstained human pancreas cells showing experimental gates used to sort β cells from donor 3. Sorted cells passed through gate 1 and gate 2. Percentages of events within each gate are indicated. (F) t-SNE map of human pancreas TD2, where β cells inside and outside of GateID gates are colored red and blue, respectively. (G and H) Barplots and t-SNE maps showing the outcome of GateID α and β cell enrichments for (G) donor and (H) donor 4 on BD FACSJazz. Gates were predicted on unstained TD2. See also |
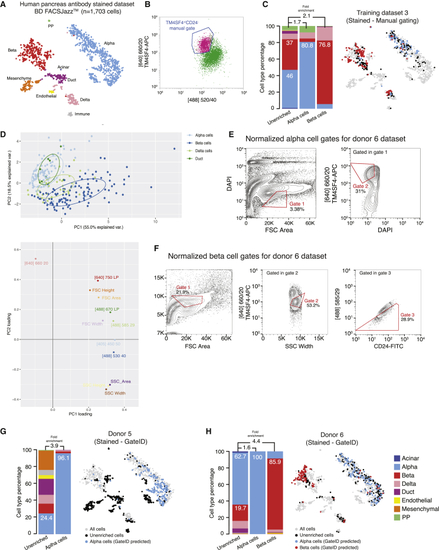
Gates for Enrichments of α and β Cells from Antibody-Stained Pancreatic Tissue on BD FACSJazz (A) t-SNE map of the human pancreas antibody-stained dataset (TD3, donors 5 and 6). Single cells are colored based on cell type. (B) FACS plot of TD3, showing the manual sorting gate for α cells. Displayed cells are live singlets. (C) Barplot and t-SNE map showing the outcome of manual gating enrichments for TD3 on BD FACSJazz. (D) Upper panel: PCA of TD3 (antibody-stained, BD FACSJazz). Each point represents a single cell, and single cells are colored based on cell type identification from scRNA-seq. The ellipses represent normal contour lines that contain 50% of the data points for each cell type. Bottom panel: PC1 and PC2 loadings. Each point represents a FACS channel measured by the BD FACSJazz. (E and F) Contour plots of antibody-stained human pancreas cells showing experimental sorting gates for (E) α cells and (F) β cells for donor 6 (representative example for donor 5 and 6 α cell enrichment experiments) on BD FACSJazz. Sorted cells passed through normalized gate 1 and gate 2. Percentages of events within each gate are indicated. (G and H) Barplots and t-SNE maps showing the outcome of GateID enrichments for (G) donor 5 and (H) donor 6 on BD FACSJazz. See also |
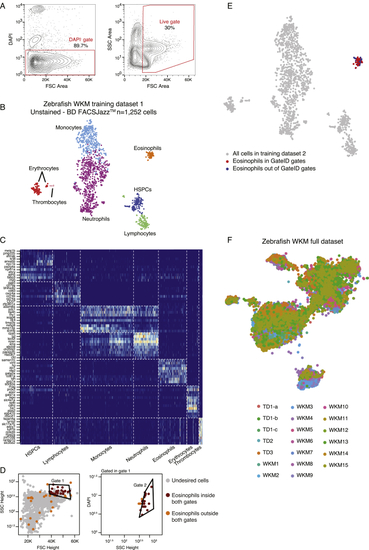
Generation of the Zebrafish WKM Unstained TD, Related to (A) Contour plots of sorted live WKM cells to generate WKM TD1. The left panel show the DAPI- gate used to select live cells and the right panel shows the gate used to exclude erythrocytes that are low in FSC Height space. (B) t-SNE map of zebrafish WKM TD1 generated on BD FACSJazz. Single cells are colored based on cell type. (C) Heatmap showing marker genes for all hematopoietic cell types identified in the WKM full dataset. (D) GateID predicted gates to isolate eosinophils from unstained WKM TD1. Grey points are undesired cells in TD1. Orange points are eosinophils outside both GateID predicted gates (excluded by GateID). Red points are eosinophils inside both GateID predicted gates (sorted by GateID). (E) t-SNE map of zebrafish WKM TD1 where eosinophils inside and outside of GateID gates are colored in red and blue respectively. (F) t-SNE map of experimental contributions to the zebrafish WKM full dataset. Single cells are colored based on experiment number. |
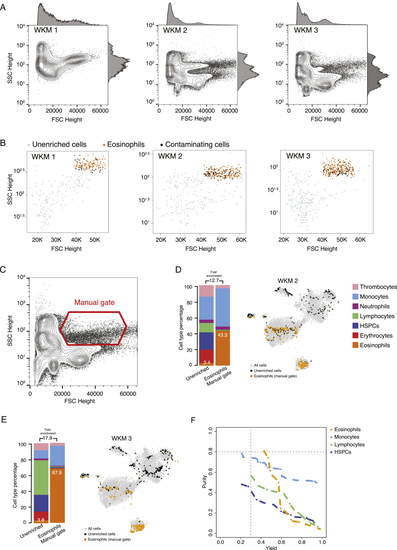
Eosinophil Enrichments with Unstained WKM Cells on BD FACSJazz, Related to (A) FSC Height and SSC Height contour plots of all WKM cells analyzed for eosinophils enrichment experiments WKM 1 to 3. Histograms on each plot show population density is FSC and SSC Height channels. (B) Plots showing sorted unenriched and GateID enriched cells for eosinophil experiments WKM 1 to 3 in FSC and SSC Height. Grey points are cells from the unenriched library and colored points are cells from the GateID enriched library. Sorted eosinophils in the GateID enriched library are highlighted in orange and sorted non-eosinophil contaminating cells in the GateID enriched library are represented in black. (C) FSC Height and SSC Height contour plot of all WKM cells for WKM 2. The eosinophil manual gate used in WKM 2 experiment is represented in red (representative for WKM 2 and 3 manual enrichment experiments). (D and E) Barplots and t-SNE maps showing the outcome of eosinophil enrichments using manual gating for two independent experiments: (D) WKM 2 and (E) WKM 3 on BD FACSJazz. In the barplots, numbers in the bars indicate the percentage of eosinophils in the corresponding library and numbers above the bars indicate the cell type fold enrichment between unenriched and manually enriched library. On the t-SNE maps, gray points represent all cells from the WKM dataset. For each experiment, black dots are single cells in the unenriched library for a given experiment, while colored dots are single cells in the manually enriched library for the same experiment. (F) Curves showing trade-off between yield and purity of GateID solutions for eosinophils, monocytes, lymphocytes and HSPCS for the unstained TD1. All gates for a given cell type with lower purity or yield are internal to these curves and are not shown. Dashed lines represent our thresholds for acceptable yield (0.3) and purity (0.8). |

General Dyes Enhance Hematopoietic Cell Type Segregation in FACS Space and Allow Purification of Eosinophils and HSPCs on BD FACSJazz, Related to (A) t-SNE map of zebrafish stained WKM TD2 generated on BD FACSJazz. Single cells are colored based on cell type. (B) t-SNE map of zebrafish stained WKM TD3 generated on BD FACSInflux. Single cells are colored based on cell type. (C) Contour plots of stained WKM cells showing normalized sorting gates for eosinophils for WKM 8 experiment (representative example for WKM 4, WKM 8 and WKM 9 eosinophil enrichments) on BD FACSJazz. Sorted cells passed through gate 1 and gate 2. Percentages of events within each gate are indicated. (D) t-SNE map of zebrafish WKM TD2 where eosinophils inside and outside of GateID gates are colored in red and blue respectively. (E) Projection of the sorted GateID eosinophils in WKM 8 (representative example for WKM 4, 8 and 9 eosinophil enrichment experiments) in FSC Height versus SSC Height. (F and G) Barplots and t-SNE maps showing the outcome of eosinophil enrichments for (F) WKM 8 and (G) WKM 9 on BD FACSJazz. (H) Left panel: FSC Height versus CD41-EGFP dot plot of live singlet WKM cells. The CD41low gate is represented in red. Right panel: projection of the CD41low sorted cells in FSC Height versus SSC Height. (I) Barplot indicating cell type percentages for sorted CD41low cells. Percentage in the barplot indicates HSPC percentage in the sorted library. (J) t-SNE map showing sorted CD41low cells. Non HSPCs are represented in gray and HSPCs in red. |

HSPC Enrichments with Stained WKM Cells on BD FACSInflux, Related to (A) Contour plots of stained WKM cells showing experimental sorting gates for HSPC for the WKM 11 experiment (representative example for WKM 11, 12 and 13 HSPC enrichment experiments) on BD FACSInflux. Sorted cells passed through gate 1 and gate 2. Percentages of events within each gate are indicated. (B) t-SNE map of zebrafish WKM TD3 where HSPCs inside and outside of GateID gates are colored in red and blue respectively. (C) Projection of the sorted GateID HSPCs for WKM 10 in FSC Height versus SSC Height (representative example for WKM 11, 12 and 13 HSPC enrichment experiments). (D–F) Barplots and t-SNE maps showing the outcome of HSPC enrichments for (D) WKM 11, (E) WKM 12 and (F) WKM 13 on BD FACSInflux. (G) Scatterplot showing experimental purities of GateID predicted gates determined by scRNA-seq (x axis) and histological analysis (y axis) for HSPCs (dark blue) and monocytes (light blue) on BD FACSJazz (triangle) and BD FACSInflux (circle). (H) Design of (I) Barplots indicating cell type percentages for the lymphocyte |
Monocyte Enrichments with Stained WKM Cells on BD FACSJazz, Related to (A) Contour plots of stained WKM cells showing experimental sorting gates for monocytes for WKM 8 experiment (representative example for WKM 4, 7 and 8 monocyte enrichment experiments) on BD FACJazz. Sorted cells passed through gate 1 and gate 2. Percentages of events within each gate are indicated. (B) Projection of the sorted GateID monocytes for WKM 8 in FSC Height versus SSC Height (representative example for WKM 4, 7 and 8 monocyte enrichment experiments). (C) t-SNE map of zebrafish WKM TD2 where monocytes inside and outside of GateID gates are colored in red and blue respectively. (D–F) Barplots and t-SNE maps showing the outcome of monocyte enrichments for (D) WKM 4, (E) WKM 7, and (F) WKM 8 BD FACJazz. |
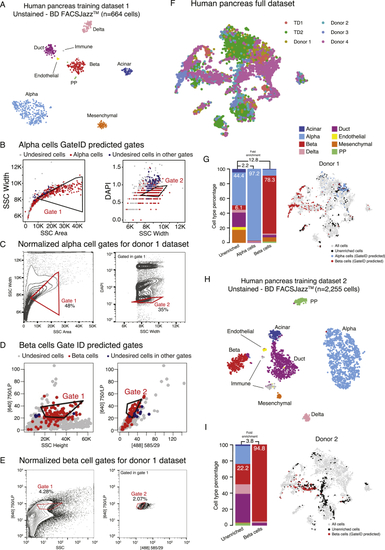
Gates for Enrichments of α and β Cells from Unstained Pancreatic Tissue on BD FACSJazz, Related to (A) t-SNE map of human pancreas TD1 generated on on BD FACSJazz. Single cells are colored based on cell type. (B) GateID predicted gates to isolate alpha cells from human pancreas. Gates were predicted on TD1. Red points show desired cells (alpha cells) present in TD and the blue points show undesired cells falling in the other gate. (C) Contour plots of unstained human pancreas cells showing experimental gates used to sort alpha cells from donor 1. Sorted cells passed through gate 1 and gate 2. Percentages of events within each gate are indicated. (D) GateID predicted gates to isolate beta cells from human pancreas. Gates were predicted on TD1. Red points show desired cells (beta cells) present in TD and the blue points show undesired cells falling in the other gate. (E) Contour plots of unstained human pancreas cells showing experimental gates used to sort beta cells from donor 1. Sorted cells passed through gate 1 and gate 2. Percentages of events within each gate are indicated. (F) t-SNE map of human pancreas full dataset. Single cells are colored based on experiment number. (G) Barplots and t-SNE map showing the outcome of GateID alpha and beta cell enrichments for donor 1 on BD FACSJazz. Gates for were predicted on unstained TD1. (H) t-SNE map of human pancreas TD2 generated on BD FACSJazz. Single cells are colored based on cell type. (I) Barplots and t-SNE map showing the outcome of GateID beta cell enrichment for donor 2 on BD FACSJazz. Gates for were predicted on unstained TD2. |

α and β Cells Purified with GateID Can Be Used for Methylome Analysis, Related to (A) Average beta cell purity depending on TD size and proportion of contaminating cells in the TD. The y axis denotes the average GateID purity and its standard deviation. The x axis represents the fold change of the proportion of the contaminating cells in the TD. The curves represent different datasets: 1x is the original pancreas TD1 (678 cells), while 2x and 3x datasets are enlarged by two (1356 cells) or three (2034 cells) fold, respectively. (B) Hierarchical clustering of mean methylation values for differentially methylated bins from the most variable bins, wherein methylation is shown in a gradient from blue (low) to red (high). Methylation in pancreatic alpha and beta cells cluster by cell type instead of donor of origin (indicated in columns). Bins with annotated genes of interest (rows) are shown on the right. (C) Bins used in (D) were annotated and grouped by their genomic features for donor 4, wherein each point represents an average methylation value for a certain bin. Average methylation from alpha cells is shown on the x axis while y axis represents beta cells. (D and E) Histogram of UMI counts and number of detected genes per cell for (D) zebrafish WKM full dataset and (E) human pancreas full dataset. (F) Purity estimate for 100 samples of gate optimization for a pair of gates using different optimization algorithms. The figure shows that MA-LS-Chains shows the best purity in comparison to 8 different optimization algorithms used here. (G) Time (in seconds) 100 samples of gate optimization for a pair of gates using different optimization algorithms. NMK and BOQA algorithms are fast but at the cost of substandard solution for the gate prediction problem. (H) Workflow of the normalization of GateID predicted gates to a new experimental dataset. In step a, the data of 10000 events is exported live from the FACS machine to a laptop. In step b, the GateID gates are normalized leading to normalized gate coordinates (for each gate vertex (rows) the x and y gate coordinates are printed). Finally, in step c, the normalized gate coordinated are imported back into the FACS instrument via a software interface or the XML file of the workspace). |
Reprinted from Cell, 179, Baron, C.S., Barve, A., Muraro, M.J., van der Linden, R., Dharmadhikari, G., Lyubimova, A., de Koning, E.J.P., van Oudenaarden, A., Cell Type Purification by Single-Cell Transcriptome-Trained Sorting, 527-542.e19, Copyright (2019) with permission from Elsevier. Full text @ Cell