
Figure S5
- ID
- ZDB-FIG-191230-904
- Publication
- Baron et al., 2019 - Cell Type Purification by Single-Cell Transcriptome-Trained Sorting
- Other Figures
- All Figure Page
- Back to All Figure Page
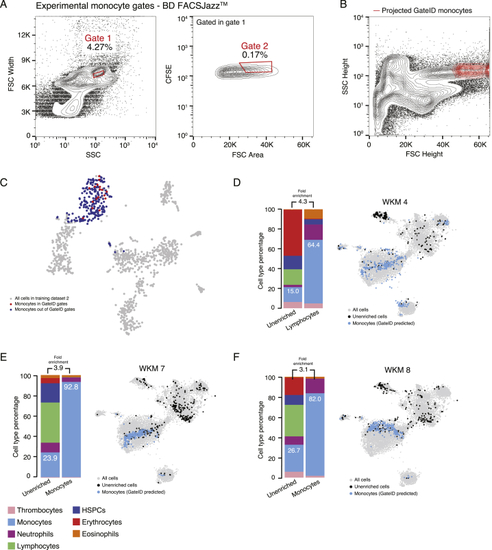
Monocyte Enrichments with Stained WKM Cells on BD FACSJazz, Related to (A) Contour plots of stained WKM cells showing experimental sorting gates for monocytes for WKM 8 experiment (representative example for WKM 4, 7 and 8 monocyte enrichment experiments) on BD FACJazz. Sorted cells passed through gate 1 and gate 2. Percentages of events within each gate are indicated. (B) Projection of the sorted GateID monocytes for WKM 8 in FSC Height versus SSC Height (representative example for WKM 4, 7 and 8 monocyte enrichment experiments). (C) t-SNE map of zebrafish WKM TD2 where monocytes inside and outside of GateID gates are colored in red and blue respectively. (D–F) Barplots and t-SNE maps showing the outcome of monocyte enrichments for (D) WKM 4, (E) WKM 7, and (F) WKM 8 BD FACJazz. |
Reprinted from Cell, 179, Baron, C.S., Barve, A., Muraro, M.J., van der Linden, R., Dharmadhikari, G., Lyubimova, A., de Koning, E.J.P., van Oudenaarden, A., Cell Type Purification by Single-Cell Transcriptome-Trained Sorting, 527-542.e19, Copyright (2019) with permission from Elsevier. Full text @ Cell