
- Title
-
Basal Protrusions Mediate Spatiotemporal Patterns of Spinal Neuron Differentiation
- Authors
- Hadjivasiliou, Z., Moore, R.E., McIntosh, R., Galea, G.L., Clarke, J.D.W., Alexandre, P.
- Source
- Full text @ Dev. Cell
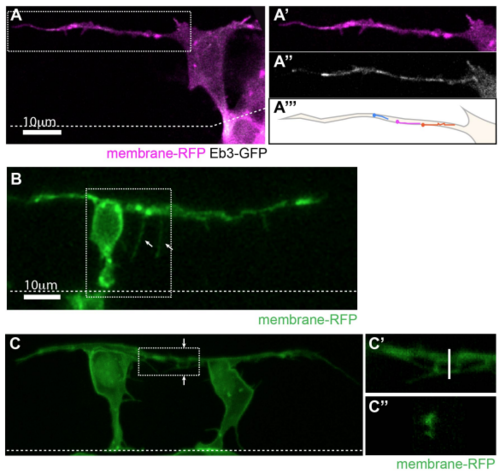
Basal protrusions contain dynamic microtubules, form filopodia and can overlap (related to Figure 1). A) T-shaped differentiating neuron with a long basal protrusion. White box marks the area of higher magnification shown in A’-A’’’). A’) Membrane-RFP. A’’) EB3-GFP (Movie 2). A’’’) Illustration of EB3-GFP comet trajectories during a 30 second timelapse period. B) T-shaped cell with filopodia (arrows) on basal protrusion (Movie 3). C) Two neurons differentiating 18µm apart with overlapping basal arms. C’) Higher magnification of white box in C). C’’) Cross-section of the basal protrusions at the line shown in C’). All images are projected images from confocal z-stacks. Dashed line shows the apical surface. |

Neuronal spacing pattern in the zebrafish spinal cord (related to Figure 4). A) and B) Dorsal views of Vsx1 expressing cells revealed by in situ hybridization (A) and Vsx1:GFP transgene expression (B) at 20 hfp. Dashed line shows the apical surface. C) and D) Lateral views of evx1 (C) and eng1b (D) expressing spinal neurons revealed by in situ hybridization at 20hpf. E) Box-and-whisker plot showing the distance between neurons of the same subtype in the most caudal spinal region at 20hpf (mean ± SD; Vsx1:GFP: 44.4 ± 14.1 µm, n=18; evx1: 41 ± 15.4 µm, n=7; eng1b: 35.7 ± 13.3 µm, n=5 embryos). The line inside the box represents the median and whiskers represent minimum and maximum values. Data analysed using Kruskal-Wallis with Dunn’s multiple comparison test (non-significant). F and G) Dorsolateral views showing the relative positions of Vsx1:GFP and evx1 (F) or eng1b (G) expressing cells revealed by in situ hybridisation. H) Frequency distribution chart shows the relative positions of evx1 and en1b expressing interneurons between two pairs of Vsx1:GFP expressing neurons. The distance between the two pairs of Vsx1:GFP neurons has been normalised from 0 (anterior) to 1 (posterior). All evx1 and eng1b expressing neurons that shared the same position with a Vsx1 neuron have been included in position (1). |
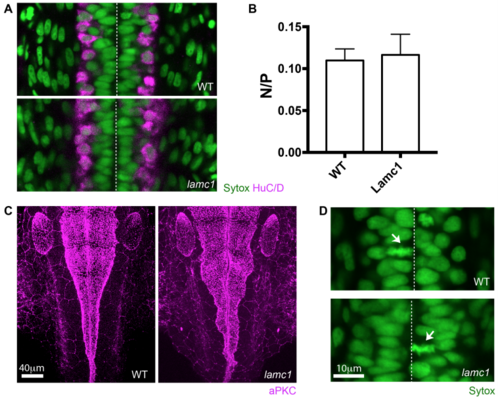
Lamc1 mutant characterization (related to Figure 6). A) Dorsal view of spinal cord in wild type and lamC1 mutant embryos. HuC/D immunoreactivity (magenta) reveals the position of spinal cord neurons at 24 hpf. B) Graph showing the ratio of neurons to progenitors in wild type and lamC1 mutant spinal cords at 24 hpf (mean ± SD, 0.11 ± 0.01 for wild type and 0.12 ± 0.02 for lamc1 mutant, unpaired one-tailed t-test p=0.4428). C) Dorsal view of wild type and lamC1 mutant embryos at the hindbrain. aPKC immunoreactivity (magenta) shows the position of the apical surfaces at 28 hpf. D) Dorsal view of spinal cord in wild type and lamC1 mutant embryos showing apical mitoses (arrows). Dashed line shows position of the apical surfaces in A) and D). Nuclei labelled by Sytox in A) and D). |

Differentiating Spinal Neurons Transiently Elongate Two Long Basal Protrusions along the A/P Axis before Detaching from the Apical Surface (A) Diagram to show spinal neurons differentiate with an initial long-distance spacing pattern (t1). Later differentiating neurons of the same type subsequently fill in the gaps between the earlier differentiated cells (t2 and t3) to generate a near continuous column of neurons. Lateral view of spinal cord, dorsal to top. (B) Image sequence from confocal time lapse from dorsal view illustrates the early steps in neuronal differentiation that precede axogenesis in the spinal cord. A differentiating neuron (green) transiently adopts a T shape through the maintenance of an apical attachment and the elongation of two long cellular protrusions at the basal surface of the neuroepithelium (arrowed in time point 3h18). Following the retraction of basal protrusions, the apical process detaches (blue asterisk in timepoint 5h42). The axon is formed (blue arrow in 8h54) and grows ventrally and across the midline (see (B′) Transverse reconstruction of B at 9h48. Cells visualized with membrane-GFP, with non-neuronal cells artificially colored in magenta. Dashed line shows position of the apical surfaces. (B″) Diagram summarizes the steps involved in neuronal differentiation: transient formation of basal protrusions followed by their retraction, apical detachment and axonal growth. Apical and basal surfaces of the neuroepithelium are outlined by a blue (bottom) and gray (top) dashed line, respectively. (C) Kymographic representation of extension and retraction of basal protrusions of a differentiating neuron (green) viewed laterally. (D) Box-and-whisker plot showing maximal basal extension of differentiating neurons (mean ± SD, 86.8 ± 25.3 μm, n = 21 cells) and non-differentiating neuroepithelial cells (mean ± SD, 14.3 ± 6.2 μm, n = 74 cells). The line inside the box represents the median and whiskers represent minimum and maximum values. Data analyzed using unpaired one-tail Mann-Whitney test (p-value < 0.0001). (E) Average length of individual basal protrusions during neuronal differentiation (n = 13 cells). The time has been normalized from (0), the moment in which differentiating neurons begin elongation of basal protrusions, to (1), when neurons initiate axon formation. Error bars indicate SEM. |

Stereotyped Axon Formation Follows Basal Protrusion Retraction (A) Image sequence from a time lapse showing a neuron with long basal protrusions (white arrows) that are fully retracted before axon initiation (blue arrow at time 3h09). The axon grows circumferentially and crosses the ventral floor plate (blue arrow at time 4h05) ( (B) Image sequence from a time lapse shows a neuron with long basal protrusions (white arrows) that are fully retracted before axon initiation (blue arrow at time 8h11). The axon is initiated from the ventral surface of the neuron and then grows longitudinally and ipsilaterally along the spinal cord (blue arrow at time 11h29). (C) Image sequence from a time lapse of a motor neuron with short basal protrusions (white arrows) that are retracted by time point 0h35. The exact point of axon extension is not clear, but the axon (blue arrow) changes direction to leave ventral spinal cord and grow into muscle at time 3h30. (D) Summary diagram of neuron morphologies shown in (A)–(C). Neurons were labeled with membrane-GFP (green) and H2B-RFP to show nuclei in A and C. All images are projected images from confocal z stacks. |

Spinal Non-apical Progenitors but Not Newborn Telencephalic Neurons Extend Basal Protrusions prior to Apical Detachment (A) Image sequence showing a non-apical progenitor (NAP) with elongated basal protrusions (white arrows). The NAP retracts the apical attachment (blue asterisk in time point 4h20) before basal protrusions fully retract. Following apical detachment, the cell body rounds up away from apical surface of the neuroepithelium and undergoes mitosis (green arrow at time point 6h12). The NAP is neurogenically committed and produces two neuron daughters, each initiating axon growth at different time points (blue arrows indicate two growth cones at time 12h36) ( (B) Graph showing the changes in length over time of the two basal protrusions from the NAP shown in A. Time points of when apical detachment, mitosis, and first axon elongation take place are indicated. (C) Image sequence from time lapse showing a pair of differentiating telencephalic neurons. Long basal protrusions are not observed. Short basal protrusions from time point 0h35 on are the initial growth of axons. The neurons detach from the apical surface at 0h35 and 1h17 (blue asterisks). Extending axons are visible at 4h33 (blue arrows) ( |
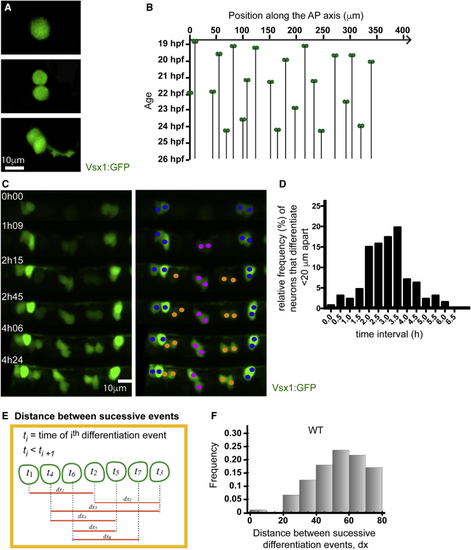
Neurons Rarely Differentiate Close Together in Time and Space (A) Vsx1:GFP expression in a single cell before, during, and after a NAP division. Following mitosis, GFP expression is maintained, and axogenesis can be followed in both daughter neurons. (B) Spatiotemporal pattern of Vsx1:GFP neuronal precursor differentiation from 19 to 27 hpf. The location of Vsx1:GFP NAPs at the time of mitosis are represented as pairs of green circles and plotted in space (x axis) and time (y axis). The black lines descending through time from the pair of green circles represent the position held by the daughter cells after mitosis. (C) Image sequence from a time lapse showing the differentiation of Vsx1:GFP neurons in one section of spinal cord through time. The left panel shows Vsx1:GFP neurons differentiating over time. In the right panel, cells have been color coded to denote sister pairs. All images are projections from small confocal z stacks. See also (D) Frequency distribution showing the difference in time between Vsx1:GFP mitoses that occur less than 20 μm apart. (E) Diagram illustrating the method used to calculate the distance between successive Vsx1:GFP differentiation events from a time-lapse movie. (F) Histogram showing the distribution of the distance between successive Vsx1:GFP differentiation events in wild-type embryos. |

Transient Basal Protrusion Express Delta Protein, and Notch Activity Is Upregulated in Their Vicinity (A and A′) DeltaD immunoreactivity (magenta) shows the localization of DeltaD aggregates in the basal protrusions and cell body of a T-shaped cell. The T-shaped cell expresses cytoplasmic GFP (green) under the DeltaD promotor. (B) A T-shaped cell labeled with membrane-mKate (magenta) extends basal protrusions in a Tg(Tp1:VenusPEST) (green) embryo. The maximal extension of one basal protrusion is labeled with an arrow and dotted line. Squares indicate the two areas used for analysis of Tp1:VenusPEST expression. (C) Graph showing the relative mean Tp1:VenusPEST fluorescence intensity under the basal protrusions compared to a control region outside the basal protrusions (unpaired one-tailed t test, p-value = 0.016, n = 13 basal protrusions (8 cells), the average (a intensity/ b intensity) is significantly greater than 1, mean ± SD = 7.2 ± 9.7). |

Laminin Depletion Reduces Basal Protrusion Length and Spacing between Successively Differentiating Neurons (A) Time-lapse sequence showing a differentiating neuron in a Laminin-depleted spinal cord (see (B) Box-and-whisker plot showing the maximum length reached by basal protrusions in wild-type (mean ± SD, 42.6 ± 20.2 μm, n = 24 cells) and (C) Histogram showing the distribution of the distance between successive Vsx1:GFP differentiation events in wild-type (orange) and (D) Graph showing the proportion of successive Vsx1:GFP differentiation events that occur within a 42.6-μm interval (the average size of wild-type basal protrusions) in wild-type embryos, |

Theoretical Predictions Support the Role of Basal Protrusions in Patterning Differentiation Through Delta-Notch-Mediated Lateral Inhibition (A–C) Histograms of the distributions of the distance between successive differentiation events predicted by theoretical model assuming a random distribution of differentiation events (A) (mean ± SD, 40.90 ± 21.55 μm), assuming lateral inhibition signaling occurs through basal protrusions of wild-type length (B) (mean ± SD, 54.53 ± 18.92 μm), or, assuming lateral inhibition signaling occurs through basal protrusions of (D) Box-and-whisker plots of the distance between successive differentiation events under various (E) Predicted relationship between the average maximum length of basal protrusions and the mean distance between sequential differentiation events. |
Reprinted from Developmental Cell, 49, Hadjivasiliou, Z., Moore, R.E., McIntosh, R., Galea, G.L., Clarke, J.D.W., Alexandre, P., Basal Protrusions Mediate Spatiotemporal Patterns of Spinal Neuron Differentiation, 907-919.e10, Copyright (2019) with permission from Elsevier. Full text @ Dev. Cell