
|
Figure 1
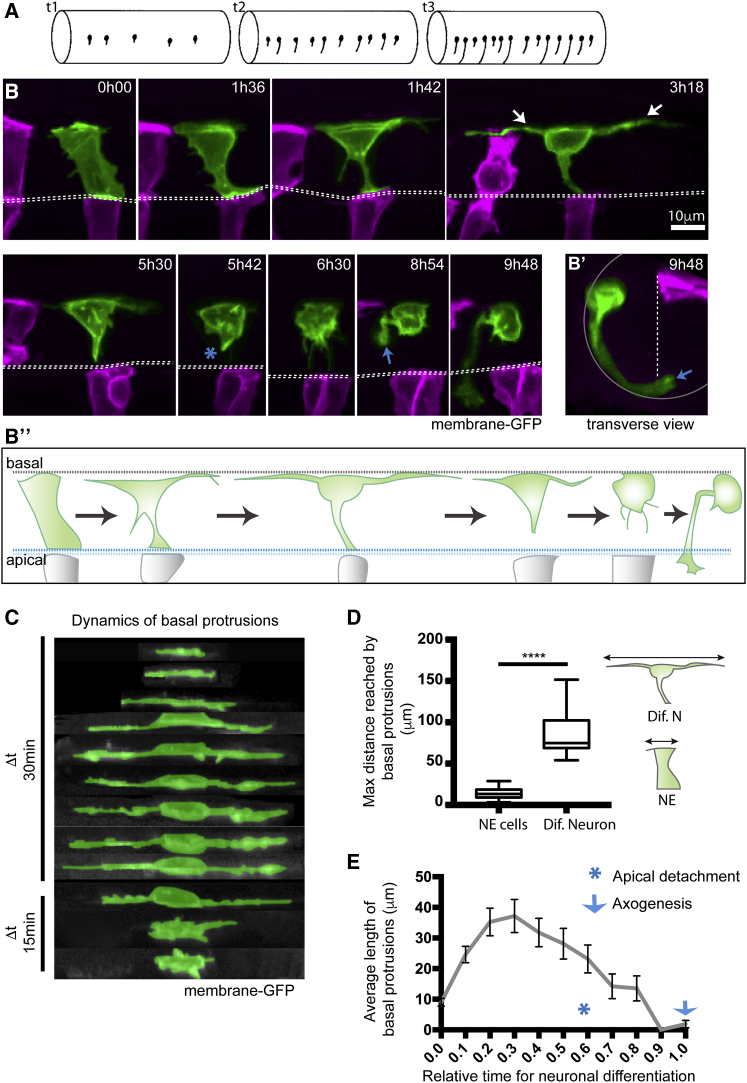
Differentiating Spinal Neurons Transiently Elongate Two Long Basal Protrusions along the A/P Axis before Detaching from the Apical Surface
(A) Diagram to show spinal neurons differentiate with an initial long-distance spacing pattern (t1). Later differentiating neurons of the same type subsequently fill in the gaps between the earlier differentiated cells (t2 and t3) to generate a near continuous column of neurons. Lateral view of spinal cord, dorsal to top.
(B) Image sequence from confocal time lapse from dorsal view illustrates the early steps in neuronal differentiation that precede axogenesis in the spinal cord. A differentiating neuron (green) transiently adopts a T shape through the maintenance of an apical attachment and the elongation of two long cellular protrusions at the basal surface of the neuroepithelium (arrowed in time point 3h18). Following the retraction of basal protrusions, the apical process detaches (blue asterisk in timepoint 5h42). The axon is formed (blue arrow in 8h54) and grows ventrally and across the midline (see
(B′) Transverse reconstruction of B at 9h48. Cells visualized with membrane-GFP, with non-neuronal cells artificially colored in magenta. Dashed line shows position of the apical surfaces.
(B″) Diagram summarizes the steps involved in neuronal differentiation: transient formation of basal protrusions followed by their retraction, apical detachment and axonal growth. Apical and basal surfaces of the neuroepithelium are outlined by a blue (bottom) and gray (top) dashed line, respectively.
(C) Kymographic representation of extension and retraction of basal protrusions of a differentiating neuron (green) viewed laterally.
(D) Box-and-whisker plot showing maximal basal extension of differentiating neurons (mean ± SD, 86.8 ± 25.3 μm, n = 21 cells) and non-differentiating neuroepithelial cells (mean ± SD, 14.3 ± 6.2 μm, n = 74 cells). The line inside the box represents the median and whiskers represent minimum and maximum values. Data analyzed using unpaired one-tail Mann-Whitney test (p-value < 0.0001).
(E) Average length of individual basal protrusions during neuronal differentiation (n = 13 cells). The time has been normalized from (0), the moment in which differentiating neurons begin elongation of basal protrusions, to (1), when neurons initiate axon formation. Error bars indicate SEM.
Reprinted from Developmental Cell, 49, Hadjivasiliou, Z., Moore, R.E., McIntosh, R., Galea, G.L., Clarke, J.D.W., Alexandre, P., Basal Protrusions Mediate Spatiotemporal Patterns of Spinal Neuron Differentiation, 907-919.e10, Copyright (2019) with permission from Elsevier. Full text @ Dev. Cell