
- Title
-
Computational 3D histological phenotyping of whole zebrafish by X-ray histotomography
- Authors
- Ding, Y., Vanselow, D.J., Yakovlev, M.A., Katz, S.R., Lin, A.Y., Clark, D.P., Vargas, P., Xin, X., Copper, J.E., Canfield, V.A., Ang, K.C., Wang, Y., Xiao, X., De Carlo, F., van Rossum, D.B., La Riviere, P., Cheng, K.
- Source
- Full text @ Elife
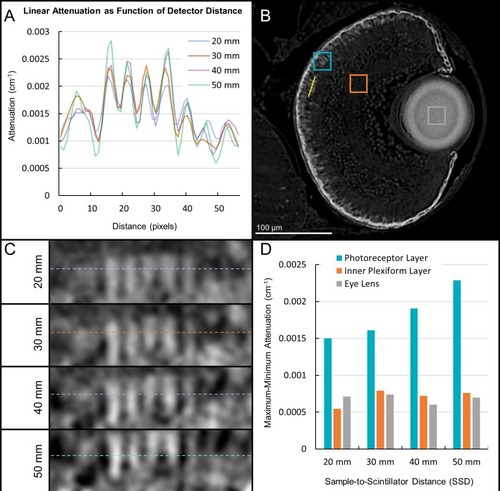
A range of sample-to-scintillator distances (SSD) was surveyed for phase contrast enhancement of edges in larval samples. A line profile ( |

A juvenile (33 dpf) zebrafish was scanned using pink-beam ( |
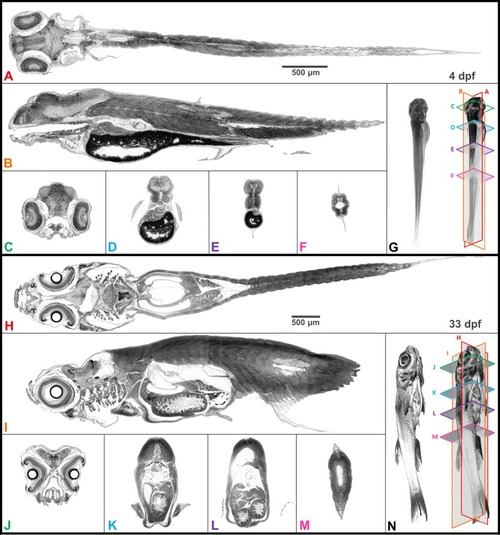
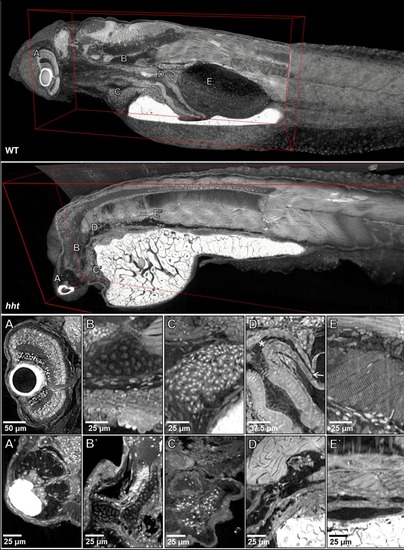
Coronal ( |

The biological validation of imaging resolution was performed through measurement of distances between Z-lines in the swim bladder striated muscle strands. Cross sections of striated muscle surrounding the swim bladder diagonally in larval (five dpf) zebrafish ( |

The biological validation of imaging resolution was performed through measurement of distances between Z-lines in the swim bladder striated muscle strands. Cross sections of striated muscle surrounding the swim bladder diagonally in larval (five dpf) zebrafish ( |
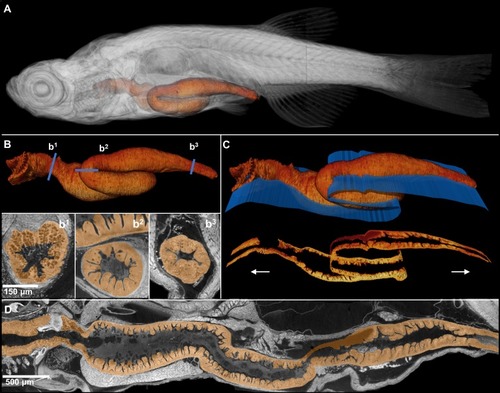
A 3D rendering of a whole juvenile (33 dpf) zebrafish is presented with highlighted gastrointestinal (GI) tract ( |

Orthogonal views (middle), a zoomed view (top), and a projection zoom view (bottom, 36 slice, 50 µm projection) of the head of a juvenile (33 dpf) zebrafish are presented. Sagittal, coronal, and transverse sections are denoted by red, yellow, and blue lines, respectively. |
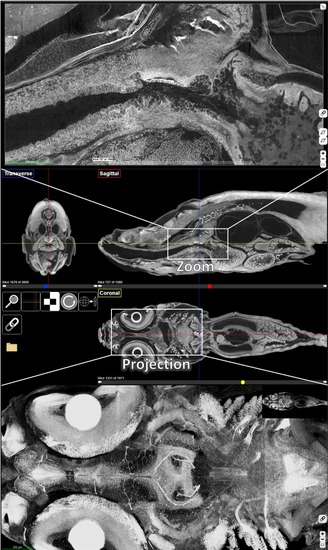
Orthogonal views (middle), a zoomed view (top), and a projection zoom view (bottom, 36 slice, 50 µm projection) of the head of a juvenile (33 dpf) zebrafish are presented. Sagittal, coronal, and transverse sections are denoted by red, yellow, and blue lines, respectively. |
|

75 × 75×75 µm regions were selected on each fish to validate detection of nuclei: sample regions R1, R2 and R3 are presented ( |
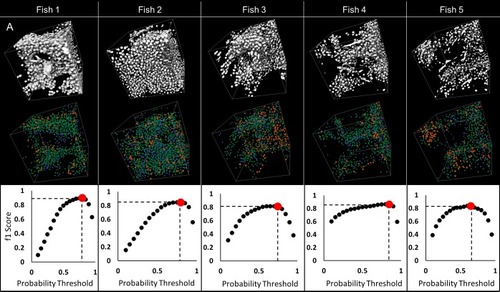
75 × 75×75 µm regions were selected on each fish to validate detection of nuclei: sample regions R1, R2 and R3 are presented ( |

PTA and osmium staining in ( |
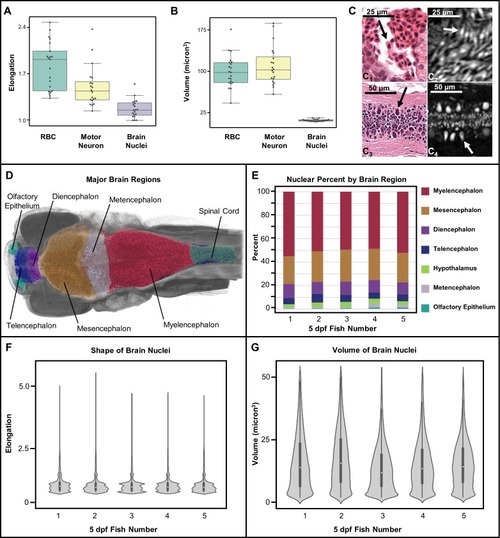
Shape and volume of manually detected brain cell nuclei varies between red blood cells (RBCs) and motor neurons (n = 20 cells each) ( |
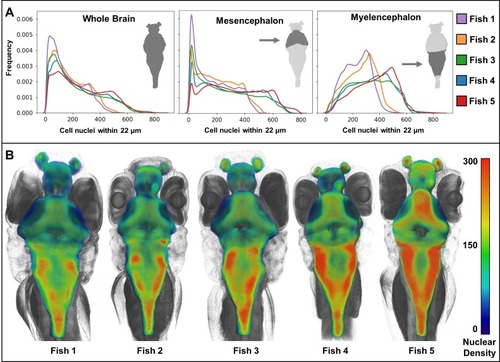
Cellular density varies between individual brain regions and carries distinct signals consistent between individual samples ( |