
- Title
-
Mutant Ahi1 Affects Retinal Axon Projection in Zebrafish via Toxic Gain of Function
- Authors
- Zhu, L., Chen, L., Yan, L., Perkins, B.D., Li, S., Li, B., Xu, H.A., Li, X.J.
- Source
- Full text @ Front. Cell. Neurosci.
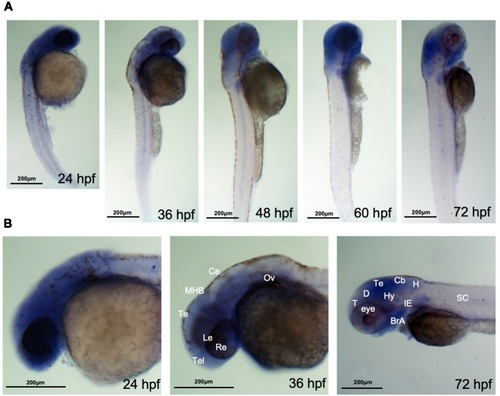
ahi1 is highly expressed in zebrafish cephalosome. (A) Whole-mount in situhybridization showed the spatiotemporal expression of ahi1 mRNA from 24, 36, 48, 60, and 72 hpf. (B) At the very early developmental stages (24 hpf and 36 hpf), the rostral feature of ahi1 mRNA expression revealed that ahi1 is more highly expressed in whole brain and ocular tissue compared with 72 hpf. T, telencephalon; D, diencephalon; Te, tectum; Hy, hypothalamus; Cb, cerebellum; H, hindbrain; BrA, brachial arches; IE, inner ear; SC, spinal cord. EXPRESSION / LABELING:
|
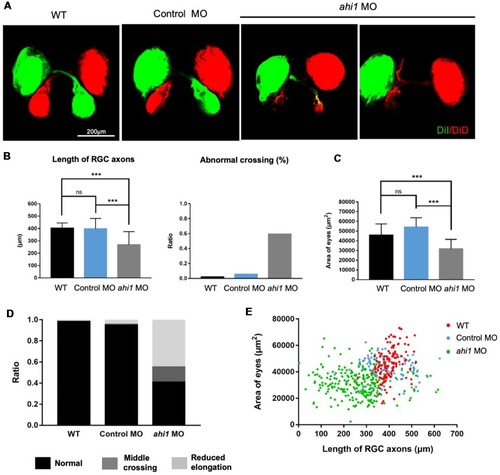
The ahi1 morpholino-injected embryos exhibited retinal ganglion cell (RGC) axon projection defects at 4 dpf. (A) The normal retinotectal projection pattern of WT or control morpholino (Control MO)-injected embryos and defective retinotectal projections in the ahi1 morpholino (ahi1 MO)-injected embryos. Scale bar: 200 μm. (B) The statistical results of the RGC axon length and abnormal middle crossing of WT (n = 106), Control MO- (n = 112), and ahi1 MO- (n = 266) injected embryos. (C) The statistical results of eye sizes of WT and ahi1 MO-injected embryos. (D) The ratios of embryos with normal retinal axon projection (Normal), abnormal middle crossing (Middle crossing), and reduced axon longation (Reduced elongation) in the WT, control MO-, and ahi1 MO-injected embryos. (E) The two-dimensional scatter diagram for eye size in each group. The X-axis represents the length of OT (μm2), and the Y-axis represents the size of eyes (μm2). Error bars denote SEM. ***p < 0.0001 was determined via Student’s t-test. PHENOTYPE:
|
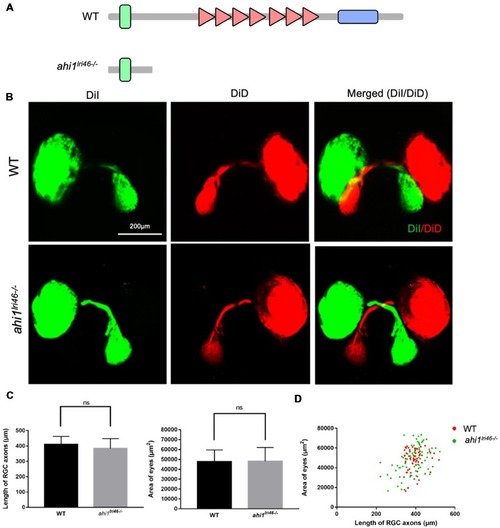
The ahi1 knockout (KO) line ahi1lri46−/−embryos exhibited no significant difference from WT in optic nerve projection length and eyes size. (A) The ahi1lri46−/− zebrafish has depleted most of the region of the ahi1 gene and only retains the N-terminal coiled-coil domain. (B) Fluorescent images of WT and ahi1lri46−/−zebrafish optic nerve projections at 4 dpf. Scale bar: 200 μm. (C) The quantified optic nerve projection length and eye sizes of WT and ahi1lri46−/− embryos. (D) The two-dimensional scatter diagram for the eye size of WT and ahi1lri46−/− embryos; the X-axis represents the length of optic nerve projection (μm2), and the Y-axis represents the size of eyes (μm2). ns, not significant. Error bars denote SEM. PHENOTYPE:
|
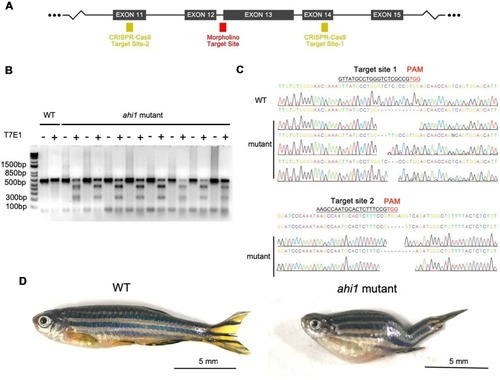
Ahi1 mutations via CRISPR/Cas9 lead to abnormal development of zebrafish. (A) The CRISPR/Cas9 target sites were designed to create mutations in exon 12 and exon 14, which were close to the ahi1 morpholino targeting site. (B) T7E1 assay results showed cleaved ahi1 DNA products by CRISPR/Cas9. (C) Sequencing data showing ahi1 DNA mutations in the ahi1 CRSIPR/Cas9-targeted (ahi1 mutant) embryos. (D) The morphology of WT and ahi1 mutant zebrafish at 3 months.
PHENOTYPE:
|
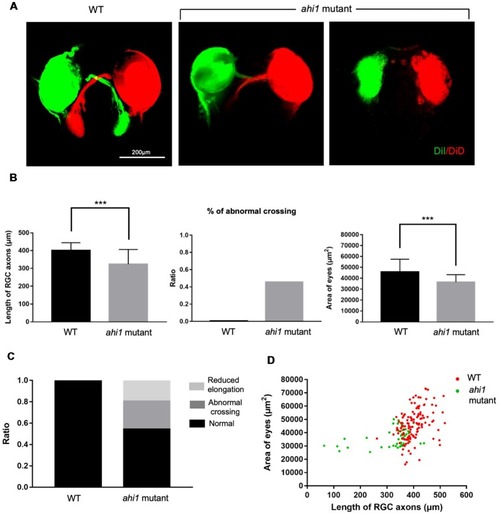
Ahi1 CRSIPR/Cas9-targeted embryos exhibited abnormal RGC axon projection patterns compared to WT embryos. (A) Fluorescent images of the optic nerve projection of WT and ahi1 CRSIPR/Cas9 targeted (ahi1mutant)-embryos at 4 dpf. Scale bar = 200 μm. (B) The statistical results of RGC axon length, abnormal crossing, and eye size of WT (n = 59) and ahi1 mutant (n = 46) embryos. (C) The ratios of embryos with normal retinal axon projection, abnormal middle crossing, and reduced axon elongation in WT and ahi1 mutant embryos. (D) The two-dimensional scatter diagram for the eye area of each WT or ahi1 mutant embryos. The X-axis represents the length of OT (μm2), and the Y-axis represents the size of eyes (μm2). Error bars denote SEM. ***p < 0.0001.
PHENOTYPE:
|