
Figure 7
- ID
- ZDB-FIG-190723-1490
- Publication
- Zhu et al., 2019 - Mutant Ahi1 Affects Retinal Axon Projection in Zebrafish via Toxic Gain of Function
- Other Figures
- All Figure Page
- Back to All Figure Page
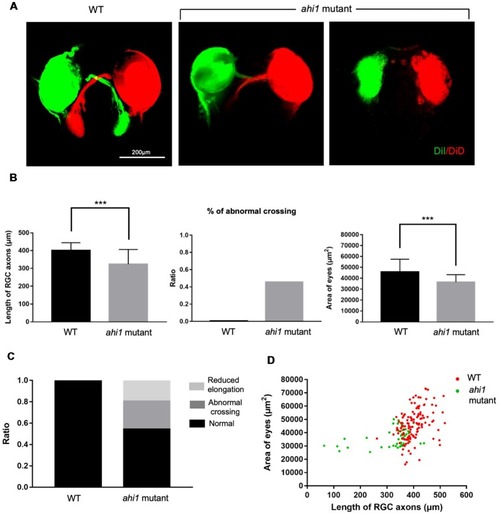
Ahi1 CRSIPR/Cas9-targeted embryos exhibited abnormal RGC axon projection patterns compared to WT embryos. (A) Fluorescent images of the optic nerve projection of WT and ahi1 CRSIPR/Cas9 targeted (ahi1mutant)-embryos at 4 dpf. Scale bar = 200 μm. (B) The statistical results of RGC axon length, abnormal crossing, and eye size of WT (n = 59) and ahi1 mutant (n = 46) embryos. (C) The ratios of embryos with normal retinal axon projection, abnormal middle crossing, and reduced axon elongation in WT and ahi1 mutant embryos. (D) The two-dimensional scatter diagram for the eye area of each WT or ahi1 mutant embryos. The X-axis represents the length of OT (μm2), and the Y-axis represents the size of eyes (μm2). Error bars denote SEM. ***p < 0.0001.
|
| Fish: | |
|---|---|
| Knockdown Reagent: | |
| Observed In: | |
| Stage: | Day 4 |