
- Title
-
Clearance by Microglia Depends on Packaging of Phagosomes into a Unique Cellular Compartment
- Authors
- Villani, A., Benjaminsen, J., Moritz, C., Henke, K., Hartmann, J., Norlin, N., Richter, K., Schieber, N.L., Franke, T., Schwab, Y., Peri, F.
- Source
- Full text @ Dev. Cell
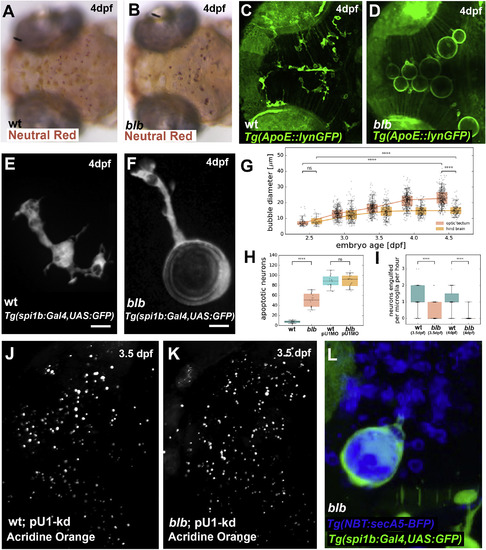
Characterization of bubblebrain, a Mutant with Bloated Microglia (A and B) Neutral red staining in a 4 dpf wild-type (A) and blbNY007 (B) embryos. (C and D) Microglia labeled with Tg(Apo-E:lynGFP) in a 4 dpf wild-type (C) and blbNY007 (D) embryo. (E and F) Microglia cell labeled with Tg(spi1b:Gal4,UAS:GFP) in a 4 dpf wild-type (E) and blbNY007 (F) embryo. Scale bar, 10 μm. (G) Quantification of the “bubble” size in blbNY007 embryos from 2.5 to 4.5 dpf in optic tectum (OT, red plots) and in the hindbrain (HB, orange plots). Whiskers: 5th/95th percentile, p value < 0.0001. (H) Quantification of apoptotic neurons visualized by Acridine Orange in wild-type (n = 20), blbNY007 (n = 17) and in wild-type (n = 18) and blbNY007 (n= 19) injected with pU1 morpholino to deplete microglia in 3.5 dpf embryos; representative images in (J) and (K). Whiskers: 5th/95th percentile, p value < 0.0001. (I) Quantifications of phagocytic events per cell per hour in wild-type (n = 50; n = 47) and blbNY007 (n = 61; n = 77) embryos at 3.5 dpf and 4 dpf, respectively. Whiskers: 5th/95th percentile, p value < 0.0001. (J and K) Dorsal view of a 3.5 dpf wild-type (J) and blbNY007 (K) embryo injected with pU1 morpholino to deplete microglia and stained with Acridine orange to visualize apoptotic neurons; quantifications in (H). (L) Microglia cell labeled with Tg(mpeg:GFP-caax) and Tg(NBT:secA5-BFP) to visualize apoptotic neurons in a 4 dpf blbNY007 embryo. EXPRESSION / LABELING:
PHENOTYPE:
|
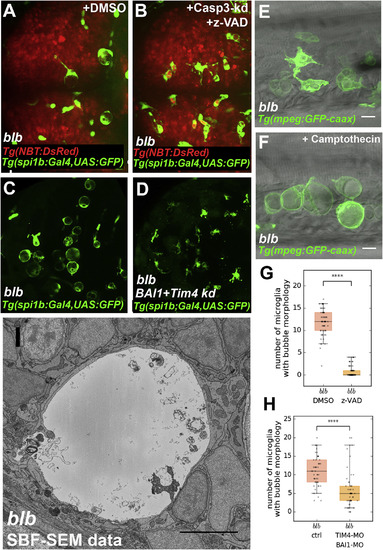
bubblebrain Functions Downstream of Cell Death and Engulfment (A and B) Dorsal view of blbNY007; Tg(spi1b:Gal4,UAS:GFP); Tg(NBT:DsRed) (A) and blbNY007; Tg(spi1b:Gal4,UAS:GFP); Tg(NBT:DsRed) injected with a Caspase 3 morpholino and treated with Z-VAD to reduce apoptosis (B); representative images quantified in (G). (C and D) Microglial cells labeled with Tg(spi1:Gal4,UAS:GFP) in 4 dpf blbNY007 (C) and in blbNY007 injected with morpholinos against BAI1 and TIM-4 to reduce engulfment (D); representative images quantified in (H). (E and F) Representative examples of trunk 4 dpf macrophages in blbNY007 (E) and blbNY007 treated with Camptothecin to increase apoptosis (F). Scale bar 10 μm. (G) Quantification of (A) and (B). Number of microglia with bubble morphology in blbNY007 (n = 61) and blbNY007 with reduced apoptosis (n = 61). Whiskers: 5th/95th percentile, p value < 0.0001. (H) Quantification of (C) and (D). Number of microglia with bubble morphology in blbNY007 (n = 50) and blbNY007 injected with Tim4+BAI1 morpholino to reduce engulfment (n = 50). Whiskers: 5th/95th percentile, p value < 0.0001. (I) Electron micrograph of a representative blbNY007 microglia at 3 dpf. Scale bar, 5 μm. |

Cloning and Characterization of Slc37a2, the Gene Underlying the blb Phenotype (A) Schematic of the slc37a2 locus. Sequences of the NY007/t30301 allele (C/T mutation) and NA150/t30913 allele (T/A mutation). (B) Dorsal view of a 4 dpf Slc37a2 knockout generated with CRISPR-Cas9 as shown in (A). Scale bar, 30 μm. (C) Dorsal view of a representative immunostaining of a 4 dpf embryo where microglia are in green Tg(mpeg:GFP-caax) and Slc37a2 in red. Scale bar, 30 μm. (D) Magnification of (C). Scale bar, 15 μm. The yellow arrow points to a phagosome positive for Slc37a2. (E) Western blot analysis of Slc37a2 (55 kDa) and Tubulin (48 kDa) in wild-type, blbNY007, and blbNI150. (F) Immunostainings of Slc37a2 (cyan) and Lamp1 (red) in RAW264.7. Scale bar, 5 μm. (G and H) Mass-spectrometry data showing normalized intensities of glucose 6-phosphate (G) not significant, and D-gluconate-6-phosphate (H) significant, p value < 0.0001, in blbNY007 and wild-type. |
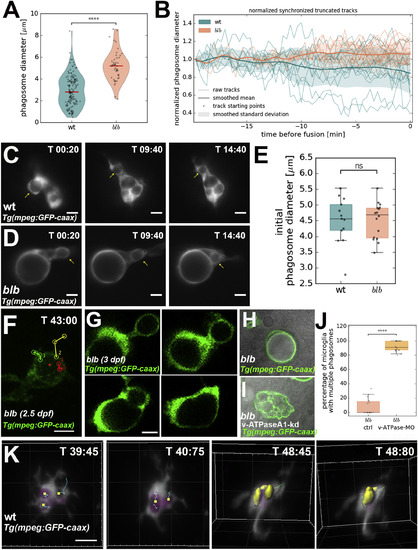
Tracking of Phagosomes Reveals that These Shrink and Converge into One Cellular Compartment (A) V-plot showing size distribution of phagosomes in wild-type (n = 27, n = 141) and blbNY007 (n = 27, n = 47). p value < 0.0001. (B) Quantification of relative vesicle diameter over time in wild-type (n = 13) and blbNY007 (n = 16). t0 corresponds to first fusion even. Data are normalized against the initial size. (C and D) Representative time-lapse of phagosomal tracking in wild-type (C) (see also Video S3, upper panel) and blbNY007 (D) (see also Video S3, lower panel). Microglia are labeled with Tg(mpeg:GFP-caax). Scale bar, 5 μm. (E) Quantification of the size of newly formed phagosomes in wild-type (n = 13) and in blbNY007 (n = 16). Whiskers 5th/95th percentile, p value: not significant. (F) SPIM time-lapse of 2.5 dpf blbNY007 microglia labeled with Tg(mpeg:GFP-caax). The red dot marks the growing vesicle. Red, yellow, and blue tracks show the trajectories of three incoming phagosomes. Time indicated in minutes. Scale bar, 10 μm. See also Video S5. (G) High time resolution SPIM time-lapse of a representative fusion event in a 3 dpf blbNY007 microglia labeled with Tg(mpeg:GFP-caax). Scale bar, 5 μm. (H and I) Representative examples of microglia labeled with Tg(mpeg:GFP-caax) in blbNY007 (H) and in blbNY007 injected with a morpholino against the a1-vATPase (I) to prevent vesicular fusion. (J) Quantification of experiment in (H) and (I). Percentage of microglia with more than 1 vesicle per cell in blbNY007 (n = 15) and blbNY007 injected with a morpholino against the a1-vATPase (n = 21), whiskers: 5th/95th percentile, p value < 0.0001. (K) SPIM time-lapse of wild-type microglia labeled in Tg(mpeg::GFP-caax). Tracking highlights fusion events. Scale bar, 5 μm. Time in minutes. See also Video S4. EXPRESSION / LABELING:
PHENOTYPE:
|
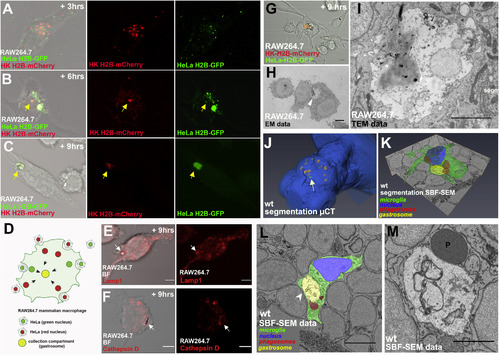
Molecular and Ultra-Structural Characterization of the Gastrosome (A–C) Fixed RAW264.7 macrophages co-cultured with HK H2B-mCherry (red) and HeLa H2B-GFP (green) for 3 h (A), 6 h (B), and 9 h (C) after induction of apoptosis in HeLa and HK. The yellow arrow indicates the collection compartment (gastrosome). (D) Schematic representation of the experiment in (A)–(C). (E) RAW264.7 macrophages fixed 9 h after apoptosis induction of unlabeled HeLa cells. Immunostaining against Lamp1 (red). The white arrow indicates the collection compartment (gastrosome). Scale bar, 5 μm. (F) RAW264.7 macrophages fixed 9 h after apoptosis induction of unlabeled HeLa cells. Immunostaining against Cathepsin D (red). The white arrow indicates the collection compartment (gastrosome). Scale bar, 5 μm. (G–I) CLEM of RAW264.7 macrophages fixed 9 h after induction of apoptosis in HK H2B-mCherry (red) and HeLa H2B-GFP (green). (G) Confocal microscopy data. Scale bar, 5 μm. (H) Low magnification EM data. White arrowhead points to the compartment of interest. Scale bar, 5 μm. (I) High magnification of the compartment of interest in TEM data. Scale bar, 2 μm. (J) Segmentation of μCT data. 4 dpf zebrafish embryo outline is in blue. Yellow and red mark near-infra-red-branding as detected by 2-photon microscopy and μCT, respectively. Outline of the microglial cell of interest is in green. (K) Segmentation of the cell of interest. Green outlines the cell body. Blue marks the nucleus. Phagosomes are in red. The receiving compartment (gastrosome) is in yellow. See also Video S7. (L) Higher magnification of the cell of interest. Green outlines the cell body, blue marks the nucleus, phagosomes are in red, and yellow marks the compartment of interest (gastrosome). White arrowhead points to the compartment of interest. Scale bar, 5 μm. (M) High magnification of the gastrosome in SBF-SEM data. P indicates a phagosome. Scale bar, 2 μm. |
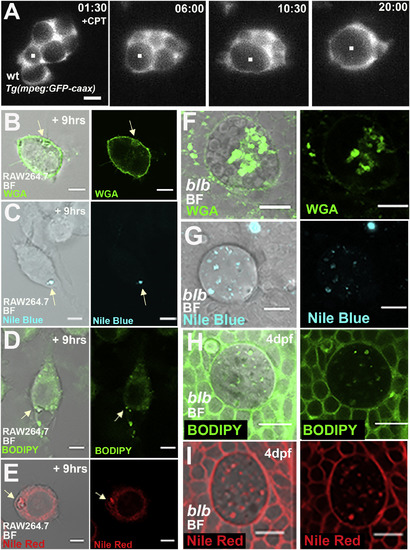
In Macrophages and Microglia, the Gastrosome Contains Lipid and Membranes (A) SPIM time-lapse of a representative 3 dpf wild-type Tg(mpeg:GFP-caax) microglia in an embryo treated with Camptothecin to increase apoptosis. Scale bar 5 μm. The while dot marks the growing compartment. See also Video S6. (B–E) RAW264.7 macrophages fixed 9 h after apoptosis induction of unlabeled HeLa cells. Stained with WGA (B), Nile Blue (C), Bodipy (D), and Nile Red (E). The white arrow points to the gastrosome. Scale bar, 5 μm. (F–I) 4 dpf blb microglia stained with WGA (F), Nile Blue (G), Bodipy (H) and Nile Red (I). Scale bar, 10 μm. EXPRESSION / LABELING:
PHENOTYPE:
|

Gastrosomal Defects Affect Microglial Functionality (A) 4 dpf wild-type Tg(mpeg:GFP-caax) microglia stained with Nile Blue (cyan) in an embryo treated with Camptothecin to increase apoptosis. Scale bar, 5 μm. The white dotted line marks the gastrosome. (B) SPIM time-lapse of representative 4 dpf wild-type Tg(mpeg:GFP-caax) microglia stained with Nile Blue (cyan) in an embryo treated with Camptothecin to increase apoptosis. Scale bar, 10 μm. The white dotted line marks the shrinking gastrosome. See also Video S8. (C) Quantification of microglia responding to an injury in wild-type and blbNY007 microglia at different developmental stages; wt, 3.5 dpf, n = 20; blbNY007, 3.5 dpf, n = 20; wt, 4 dpf, n = 20; and blbNY007, 4 dpf, n = 16; whiskers: 5th/95th percentile, p value < 0.0001. See also Video S9 (left, wild-type embryo and right, blb embryo). (D) Quantification of engulfment duration in wild-type (n = 20) and blbNY007 microglia (n = 11), whiskers: 5th/95th percentile, p value < 0.001. (E) RAW264.7 macrophages unfed (left column) or fed with HK H2B mCherry cells and fixed 24 h after apoptosis induction (right column). Slc37a2 antibody staining in untreated controls (upper panels) and in cells transfected with an siRNA targeting Slc37a2. (F) Quantification of the gastrosomal size (μm) in RAW macrophages fed with apoptotic HeLa cells in the absence or in the presence of Slc37a2 siRNA, p value < 0.0001. Representative images of this experiment in Figure S3A (yellow arrowheads). EXPRESSION / LABELING:
PHENOTYPE:
|
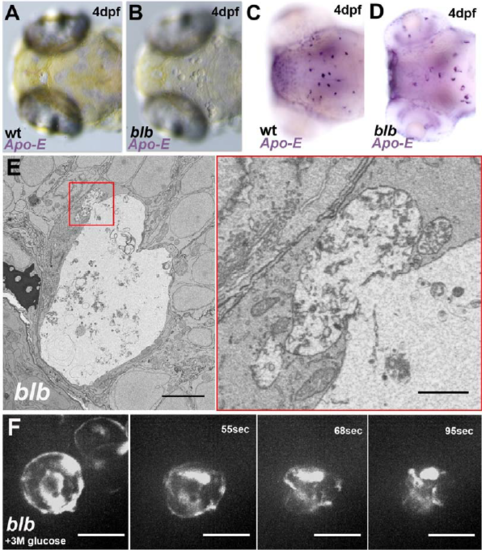
–bubblebrain microglia are under osmotic stress – Related to Figure1 and Figure 2 (A-B) Bright field view of the dorsal side of a 4 dpf wild type (A) and blbNY007 (B) embryo. (C-D) WISH against Apo-E in a 4 dpf wild type (C) and blbNY007 (D) embryo. (E) Electron micrograph of a representative blbNY007 microglia at 3 dpf. Scale bar 5μm. Magnification of a fusion event. (F, movie 2) Injection of a 3M glucose solution in the brain of a blbNY007 embryo. Microglia labeled with Tg(spi1:Gal4,UAS:GFP). Time in seconds. |

Molecular characterization of the gastrosome and its enlargement in slc37a2 mutant embryos- Related to Figure 4 and Figure 5 (A; related to Fig.4 F and movie 5) SPIM time-lapse of 2.5 dpf blbNY007 microglia labeled with Tg(mpeg:GFP-caax). The red dot marks the growing vesicle. Red, yellow and blue tracks show the trajectories of three incoming phagosomes. Time indicated in minutes. Scale bar 10μm. (B) Fixed RAW264.7 macrophages, 9hrs after apoptosis induction in unlabeled HK and HeLa cells. Immunostaining against LBPA (red). The white arrow indicates the collection compartment (gastrosome). Scale bars 5μm. (C) Fixed RAW264.7 macrophages, 9hrs after apoptosisb induction in unlabeled HK and HeLa cells. Immunostaining against Rab7 (cyan). The white arrow indicates the collection compartment (gastrosome). Scale bars 5μm. (D) RAW264.7 macrophages fixed 9 hours after apoptosis induction of nuclear-labelled HK H2B-mCherry (red) and nuclear labeled HeLa H2B-GFP (green). The image shows two cells with a collection compartment (gastrosome) each. In one the cell gastrosome is fluorescently labelled (yellow arrow) while the other is not (white arrow) as it contains cellular material that is not fluorescently labelled. Scale bars 5μm. (E) RAW264.7 macrophages fixed 9 hours after apoptosis induction of unlabelled HeLa cells. Immunostaining of Lamp1 (red) and Slc37a2 (cyan). The white arrow points to a collection compartment (gastrosome) that is Lamp1 positive and Slc37a2 negative. |
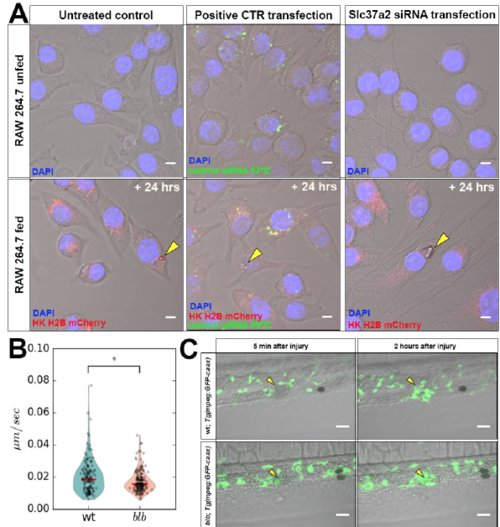
– Gastrosome enlargement in siRNA mediated Slc37a2 knock-downs in mammalian macrophages- Related to Figure 7. (A) RAW264.7 macrophages unfed (upper panels) or fed with HK H2B mCherry cells and fixed 24hrs after apoptosis induction (lower panels). Untreated controls (left column), cells transfected with a positive control for transfection (scr-siRNA FITC conjugated (green) middle column) and cell transfected with an siRNA targeting Slc37a2 (right column). The yellow arrowhead indicates the gastrosome in fed cells. Scale bars 5μm. (B) V-plot showing velocity of trunk macrophages in wild type (N=6; n=146) and blbNY007 (N= 6; n=180). P value = 0.0115 (Wilcoxon rank-sum test). (C, movie 10) Representative images of the response of trunk macrophages to injury. Upper panel macrophages in wild type and lower panel macrophages in blbNY007. 5 minutes after injury induction (left) and 2 hours after injury induction (right). Scale bar 30 μm. |
Reprinted from Developmental Cell, 49(1), Villani, A., Benjaminsen, J., Moritz, C., Henke, K., Hartmann, J., Norlin, N., Richter, K., Schieber, N.L., Franke, T., Schwab, Y., Peri, F., Clearance by Microglia Depends on Packaging of Phagosomes into a Unique Cellular Compartment, 77-88.e7, Copyright (2019) with permission from Elsevier. Full text @ Dev. Cell