
- Title
-
Characterization of Follicular Atresia Responsive to BPA in Zebrafish by Morphometric Analysis of Follicular Stage Progression
- Authors
- Migliaccio, M., Chioccarelli, T., Ambrosino, C., Suglia, A., Manfrevola, F., Carnevali, O., Fasano, S., Pierantoni, R., Cobellis, G.
- Source
- Full text @ Int J Endocrinol
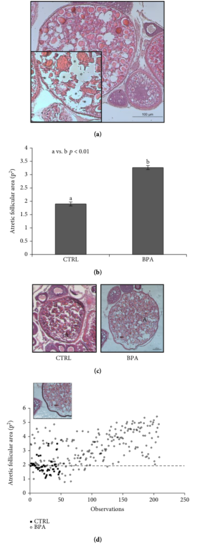
(a) Ovary section from zebrafish exposed to BPA (5 μg/L) stained with hematoxylin-eosin dye (H&E). The atretic follicle is shown. The inset shows morphological markers of atresia. (b) The atretic follicle area from unexposed (CTRL) or exposed zebrafish to BPA (5 μg/L). Results are representative of four animals/group analyzed separately and expressed as mean area ± SEM (p2). a vs. b . (c) Atretic follicle from unexposed (CTRL) and exposed zebrafish to BPA (5 μg/L) stained with H&E. (d) Distribution diagram of atretic follicle area values (p2) from CTRL (filled square) and BPA-exposed (open circle) zebrafish. The dotted line represents the mean area of atretic follicles from the CTRL group. The figure shows black line outlined using the ImageJ tool for the evaluation of the follicular area. Scale bar: 100 μm, : empty area; A: atretic follicle. |
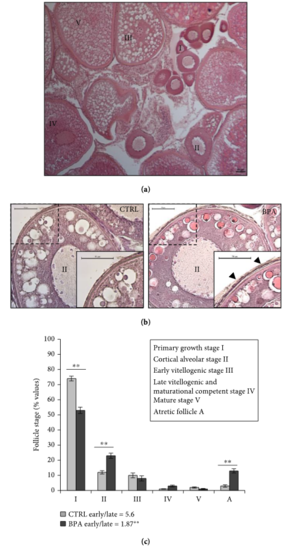
(a) Ovary section from zebrafish stained with H&E. Different follicular stages are shown. Scale bar: 50 μm. (b) Cortical alveolar stage II follicle from CTRL and BPA-exposed ovarian zebrafish stained with H&E. The inset is the enlarged view of the dashed line square. Scale bar: 50 μm. Asterisks () indicate yolk granules while arrows indicate the zona pellucida envelope which is intensely evident. (c) Number of follicles in each developmental stage from CTRL and BPA-exposed ovarian zebrafish. Results are representative of four animals/group analyzed separately and expressed in percentage (number of follicles in each stage/total follicles) as mean ± SEM. Early/late vitellogenic follicle ratio is reported for both experimental groups. Asterisks indicate statistically significant differences (). I: primary growth stage I; II: cortical alveolar stage II; III: early vitellogenic stage III; IV: late vitellogenic stage IV; V: mature stage V; A: atretic follicle. |
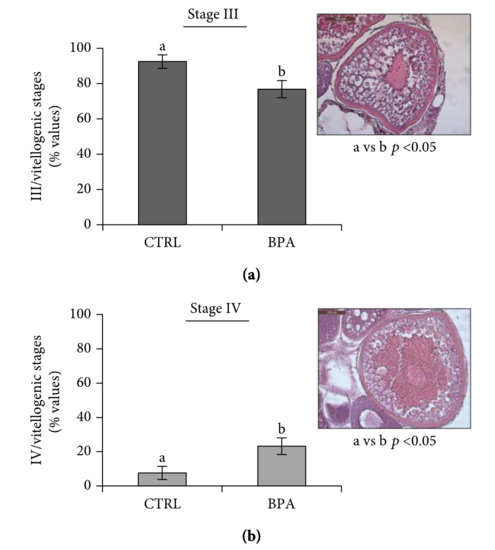
Number of stage III (a) and stage IV (b) relative to the total vitellogenic follicles from CTRL and BPA-exposed ovarian zebrafish. Results are representative of four animals/group analysed separately and expressed in percentage (number of stage III or IV/total vitellogenic follicles) as mean ± SEM. Letters indicate statistically significant differences, a vs. b p < 0 05. The images show (a) early vitellogenic stage III and (b) late vitellogenic stage IV follicles stained with H&E. Scale bar: 100 μm. |