
Image
|
Figure Caption
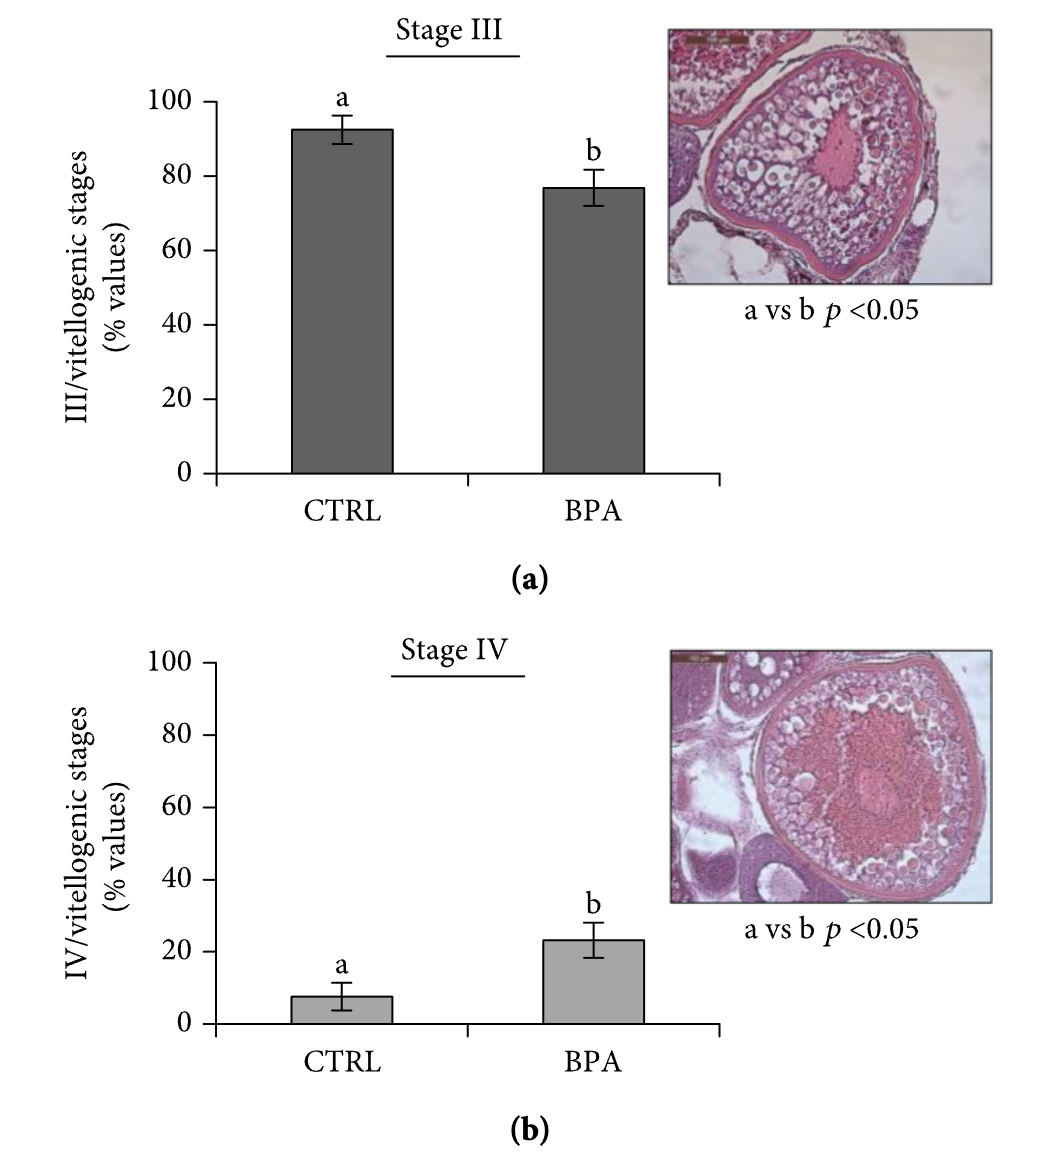
Fig. 3
Number of stage III (a) and stage IV (b) relative to the total vitellogenic follicles from CTRL and BPA-exposed ovarian zebrafish. Results are representative of four animals/group analysed separately and expressed in percentage (number of stage III or IV/total vitellogenic follicles) as mean ± SEM. Letters indicate statistically significant differences, a vs. b p < 0 05. The images show (a) early vitellogenic stage III and (b) late vitellogenic stage IV follicles stained with H&E. Scale bar: 100 μm.
Acknowledgments
This image is the copyrighted work of the attributed author or publisher, and
ZFIN has permission only to display this image to its users.
Additional permissions should be obtained from the applicable author or publisher of the image.
Full text @ Int J Endocrinol