
|
Fig. 1
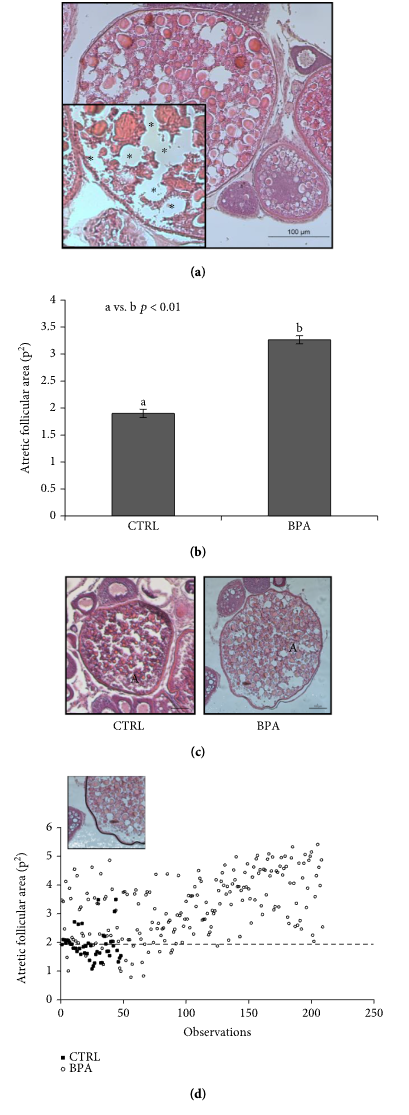
(a) Ovary section from zebrafish exposed to BPA (5 μg/L) stained with hematoxylin-eosin dye (H&E). The atretic follicle is shown. The inset shows morphological markers of atresia. (b) The atretic follicle area from unexposed (CTRL) or exposed zebrafish to BPA (5 μg/L). Results are representative of four animals/group analyzed separately and expressed as mean area ± SEM (p2). a vs. b . (c) Atretic follicle from unexposed (CTRL) and exposed zebrafish to BPA (5 μg/L) stained with H&E. (d) Distribution diagram of atretic follicle area values (p2) from CTRL (filled square) and BPA-exposed (open circle) zebrafish. The dotted line represents the mean area of atretic follicles from the CTRL group. The figure shows black line outlined using the ImageJ tool for the evaluation of the follicular area. Scale bar: 100 μm, : empty area; A: atretic follicle.