
Fig. 2
- ID
- ZDB-FIG-190606-54
- Publication
- Migliaccio et al., 2018 - Characterization of Follicular Atresia Responsive to BPA in Zebrafish by Morphometric Analysis of Follicular Stage Progression
- Other Figures
- All Figure Page
- Back to All Figure Page
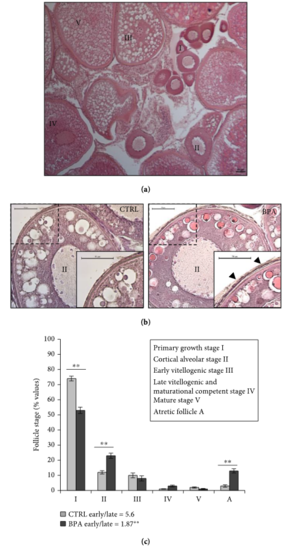
(a) Ovary section from zebrafish stained with H&E. Different follicular stages are shown. Scale bar: 50 μm. (b) Cortical alveolar stage II follicle from CTRL and BPA-exposed ovarian zebrafish stained with H&E. The inset is the enlarged view of the dashed line square. Scale bar: 50 μm. Asterisks () indicate yolk granules while arrows indicate the zona pellucida envelope which is intensely evident. (c) Number of follicles in each developmental stage from CTRL and BPA-exposed ovarian zebrafish. Results are representative of four animals/group analyzed separately and expressed in percentage (number of follicles in each stage/total follicles) as mean ± SEM. Early/late vitellogenic follicle ratio is reported for both experimental groups. Asterisks indicate statistically significant differences (). I: primary growth stage I; II: cortical alveolar stage II; III: early vitellogenic stage III; IV: late vitellogenic stage IV; V: mature stage V; A: atretic follicle. |