
- Title
-
The 3'UTRs of Myelin Basic Protein mRNAs Regulate Transport, Local Translation and Sensitivity to Neuronal Activity in Zebrafish
- Authors
- Torvund-Jensen, J., Steengaard, J., Askebjerg, L.B., Kjaer-Sorensen, K., Laursen, L.S.
- Source
- Full text @ Front. Mol. Neurosci.

The expression of mbpa isoforms is developmental- and tissue-specific. (A) Schematic illustration of the mbpa isoforms reported in the Ensembl database (release 90). The numbers to the left indicate the identity of the isoform, the numbers above each isoform indicate the position of the first nucleotide in the coding sequence and the 3’UTR, respectively, and the numbers to the right indicate the total reported length. Note that the reported sequences are not complete at the 3’ends. (B) RNA was purified from zebrafish larvae at the indicated hours post fertilization (hpf), and from adult brain (central nervous system, CNS) or lateral line peripheral nervous system (PNS). RT-PCR was performed with equal amounts of RNA as template with a primer set annealing to exon-1 and -6. Primers amplifying β-actin was included as control. The most prominent DNA bands from the CNS and PNS were sequenced and identified as variants 207 and 211, respectively. (C) Whole-mount in situ hybridization (WISH) was performed on zebrafish larvae at 96 hpf with probes annealing to different positions of the mbpa mRNA, as indicated. The probes annealing to exon-1 (mbpa all isoforms) and exon-6 (mbpa +3’UTR) gave similar results, with a distinct signal in the hindbrain and spinal cord of the CNS (white arrows), and in the posterior (black arrows) and anterior (black arrowheads) lateral line system. The probe annealing to exon-4–5 (mbpa Exon 4 + 5) resulted in a signal in the posterior (black arrows) and anterior (black arrowheads) lateral line system, however, the signal observed in the CNS with the other two probes was completely absent. Images are representative of several larvae from two independent experiments. |
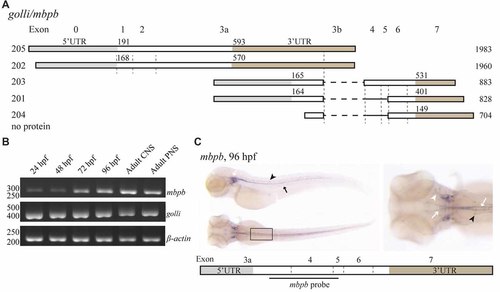
mbpb expression is similar, but not identical to mbpa expression. (A) Schematic representation of the isoforms reported in the Ensembl database (release 90) originating from two different transcription start sites in the golli/mbpb gene unit. The numbers to the left indicate the identity of the isoform, the numbers above each isoform indicate the position of the first nucleotide in the coding sequence and the 3’UTR, respectively, and the numbers to the right indicate the total reported length. Isoforms 205 and 202 encode the Golli protein, while the isoforms 203 and 201 encode Mbpb. (B) RNA was purified from zebrafish larvae at the indicated hours post fertilization, and from the adult brain (CNS) or lateral line (PNS). RT-PCR was performed with equal amounts of RNA as template with primers recognizing either mbpb or golli mRNA. A primer set for β-actin was included as a control. (C) WISH performed on zebrafish larvae at 96 hpf with a probe specific for mbpb mRNA resulted in a robust signal in the hindbrain and ventral spinal cord (white arrows), and posterior (black arrow) and anterior (white arrowhead) lateral line system. Furthermore, mbpb mRNA was detected in a symmetrical pattern in the dorsolateral spinal cord (black arrowheads). Note the presence of mbpb mRNA in the myelin sheaths covering the fine axons travelling laterally from the midline in the hindbrain, best visible in the dorsal view of the head region. Images are representative of two individual experiments with at least 15 larvae examined for each WISH probe in each experiment. |

ZFIN is incorporating published figure images and captions as part of an ongoing project. Figures from some publications have not yet been curated, or are not available for display because of copyright restrictions. EXPRESSION / LABELING:
|
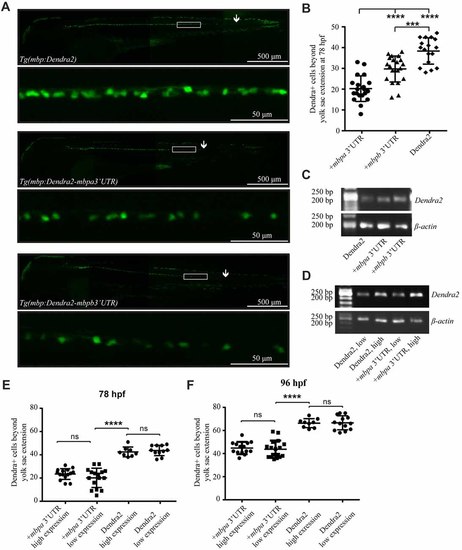
The 3’UTRs from mbpa and mbpb inhibit protein translation in vivo. (A) Lateral views of representative full-size transgenic zebrafish at 78 hpf and magnifications of the boxed areas. The most posteriorly located Dendra2-positive cell in each fish is marked with an arrow. (B) The number of Dendra2-positive cells caudal to the yolk sac extension was counted at 78 hpf. At least 17 fish were analyzed from each strain. (C) RT-PCR with RNA extracted from transgenic zebrafish larvae at 78 hpf as template. Primers recognized Dendra2 or β-actin (control). (D) RT-PCR with RNA extracted from transgenic zebrafish larvae grouped into “low expression” and “high expression” based on fluorescent intensity at 78 hpf as template. Primers recognized Dendra2 or β-actin (control) (E,F) The number of Dendra2-positive cells caudal to the yolk sac extension in transgenic larvae sorted based on the intensity of fluorescence in individual cells at 78 (D) or 96 (E) hpf. 8–16 fish were analyzed for each group. Results are shown ± SD. ns = not significant, ***p < 0.001, ****p < 0.0001. EXPRESSION / LABELING:
PHENOTYPE:
|
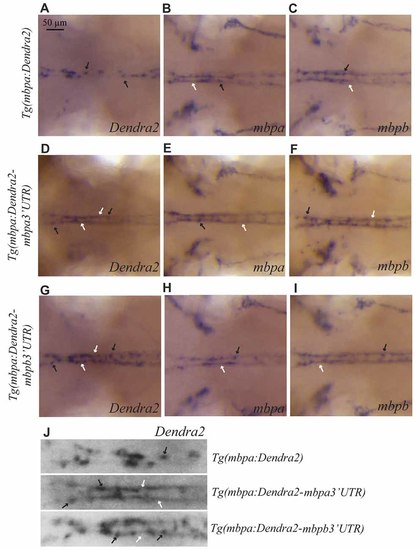
The 3’UTRs from mbpa and mbpb affect the cellular localization of mRNA. WISH on transgenic larvae with probes specific for Dendra2 (A,D,G), mbpa (B,E,H), or mbpb mRNA (C,F,I), as indicated. All pictures represent dorsal views of the neck region. mRNAs localized in cell bodies are indicated by black arrows, and localization in myelin sheaths is marked by white arrows. In the Tg(mbpa:Dendra2) larvae, Dendra2 mRNA is exclusively localized in cell bodies (A). This localization is markedly different from the localization of Dendra2 mRNA when the 3’UTR from either mbpa or mbpb is present (D,G). The localization of endogenous mbpa (B,E,H) and mbpb (C,F,I) mRNAs is similar in all three transgenic strains. (J) Enlarged view of the neck region of Dendra2 WISH of (A,D,G). EXPRESSION / LABELING:
|
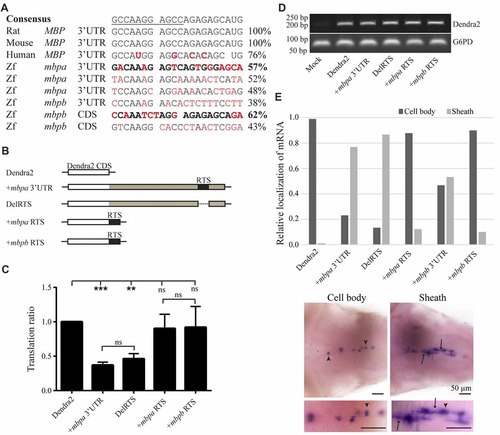
The proposed RNA trafficking sequence (RTS) sequences from mbpa and mbpb do not affect protein translation or mRNA transport. (A) The RTS consensus sequence (the hnRNP A2-binding site, A2RE11, is underlined) and the specific sequences of the rat, mouse and human RTS are shown together with proposed RTS sequences from zebrafish mbpa and mbpb mRNA. Nucleotides differing from the consensus are marked in red. The sequences from mbpa and mbpb with the highest similarity to the consensus are marked in bold. (B) The constructs tested in the translation assay are illustrated. The mbpa and mbpb RTS corresponds to the sequences marked in bold in (A). (C) The constructs shown in (B) were co-transfected with a DsRed-expressing vector into Oli-Neu cells and the translation ratio calculated as described in the “Materials and Methods” section. Data represent the means of four individual experiments ± SD. ns = not significant, **p < 0.01, ***p < 0.001. (D) RNA was extracted from a fixed number of transfected cells and RT-PCR was performed with primers specific for Dendra2 or G6PD (control). (E) The localization of mRNA in larvae with mosaic expression of the indicated constructs was defined as “Cell body” or “Sheath”. Examples of both groups are shown below the chart. Cell bodies are marked with arrowheads, while sheaths are marked with arrows. Bottom micrographs are enlarged views of top images. The relative fraction of cells with each type of mRNA distribution is plotted. For +mbpb RTS, 10 cells were analyzed. For all other constructs, 77–173 cells were analyzed. |
|
ZFIN is incorporating published figure images and captions as part of an ongoing project. Figures from some publications have not yet been curated, or are not available for display because of copyright restrictions. |

WISH staining with a probe recognizing Dendra2 mRNA in transgenic zebrafish larvae at 78. The transgenic strain is indicated above each larvae. Arrows mark the posterior boundary of the WISH signal. Pictures are representative of at least three independent experiments. |
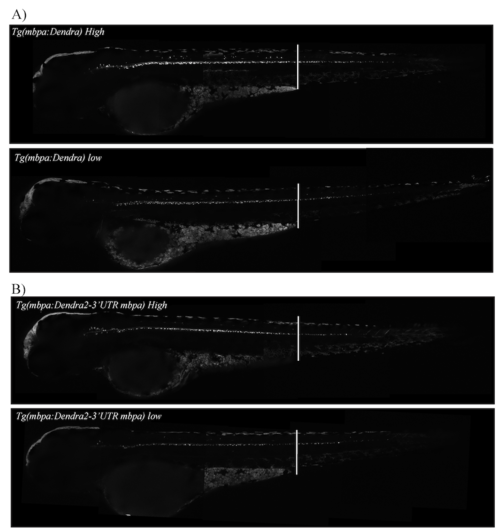
The number of Dendra2 positive cells is not correlated with expression level. (A) Tg(mbpa:Dendra2) from heterozygote crosses, micrographs of larvae categorized as high expression (top panel) or low expression (bottom panel) at 78 hpf. (B) Tg(mbpa:Dendra2-3'UTRmbpa) from heterozygote crosses, micrographs of larvae categorized as high expression (top panel) or low expression (bottom panel) at 78 hpf. |
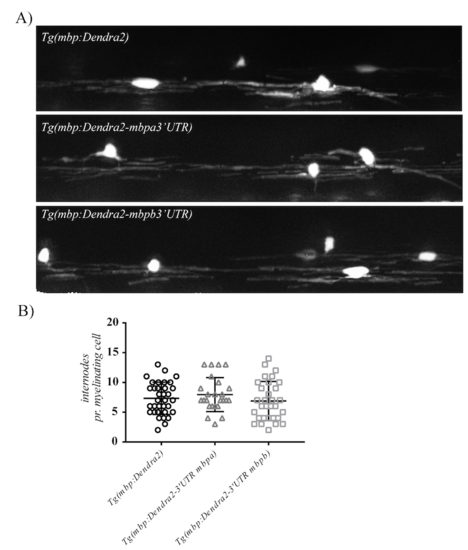
(A) Examples of oligodendrocytes with Dendra2-positive internodes in transgenic larvae. (B) the number of internodes pr. cell was counted in oligodendrocytes with Dendra2-positive internodes. Mean values +/- SD are plotted. Note that no difference in the mean number of internodes generated pr. cell was observed between the different transgenic lines. |