
Image
|
Figure Caption
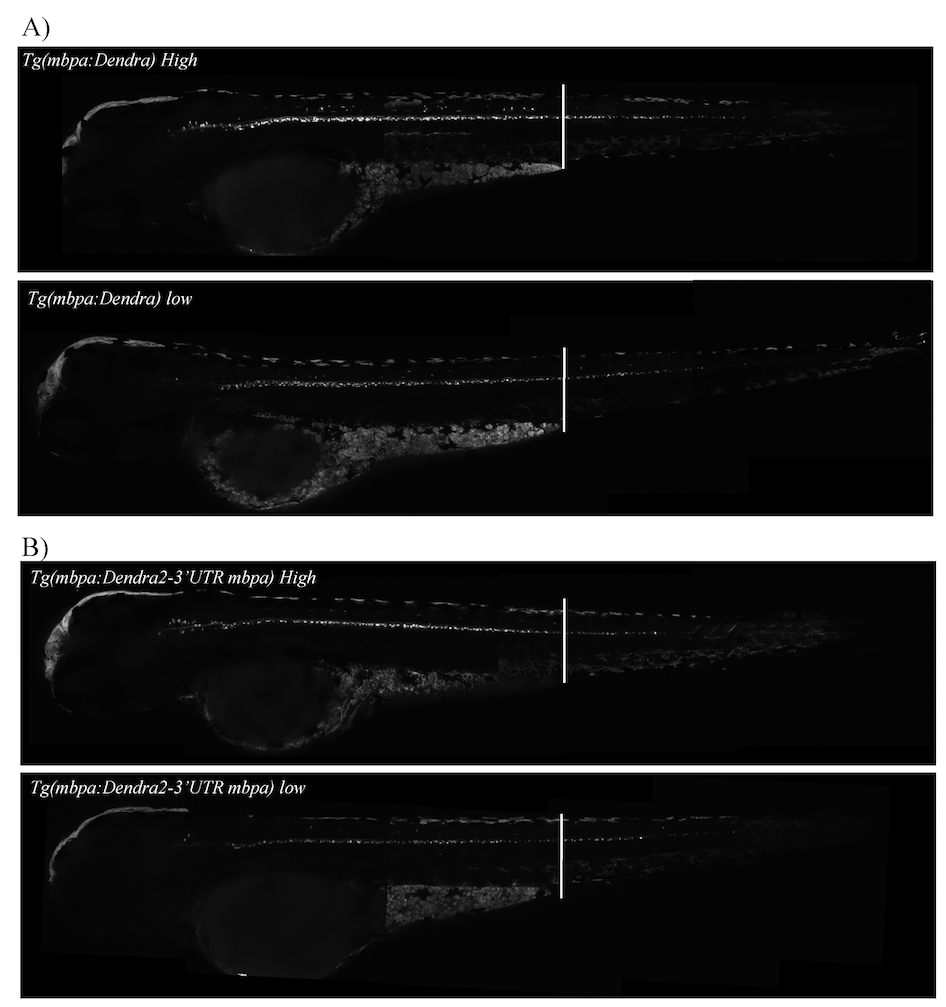
Fig. S2
The number of Dendra2 positive cells is not correlated with expression level. (A) Tg(mbpa:Dendra2) from heterozygote crosses, micrographs of larvae categorized as high expression (top panel) or low expression (bottom panel) at 78 hpf. (B) Tg(mbpa:Dendra2-3'UTRmbpa) from heterozygote crosses, micrographs of larvae categorized as high expression (top panel) or low expression (bottom panel) at 78 hpf.
Acknowledgments
This image is the copyrighted work of the attributed author or publisher, and
ZFIN has permission only to display this image to its users.
Additional permissions should be obtained from the applicable author or publisher of the image.
Full text @ Front. Mol. Neurosci.