
- Title
-
Post-transcriptional Modulation of Sphingosine-1-Phosphate Receptor 1 by miR-19a Affects Cardiovascular Development in Zebrafish
- Authors
- Guzzolino, E., Chiavacci, E., Ahuja, N., Mariani, L., Evangelista, M., Ippolito, C., Rizzo, M., Garrity, D., Cremisi, F., Pitto, L.
- Source
- Full text @ Front Cell Dev Biol
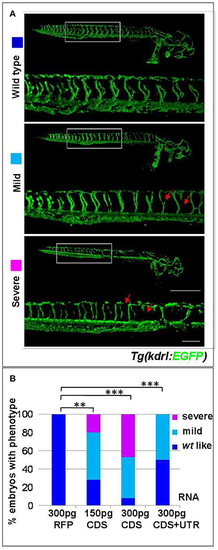
s1pr1 overexpression affects vascular development. (A) Confocal microscopy of representative 48 hpf Tg(kdrl:EGFP)s843 embryos showing vascular defects of different severity. The Tg(kdrl:EGFP)s843 embryos were injected with in vitro transcribed and capped mRNA of the full-length (CDS+UTR) or the CDS sequence of s1pr1 at the reported doses (pg). The total numbers of embryos analyzed were as follows: 300 pg RFP CDS injected n = 20; 150 pg s1pr1 CDS injected n = 22; 300 pg s1pr1 CDS injected n = 38; 300 pg s1pr1 CDS+UTR injected n = 15. Red arrows indicate examples of shorter and incomplete ISVs. Scale bar = 500 μm (zoom 100 μm). (B) Blinded quantification of the abnormal vascular phenotypes showed in (A). **P < 0.001, ***P < 0.0001. |
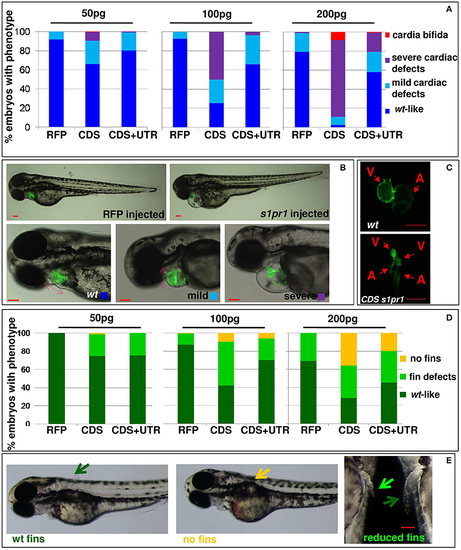
s1pr1 overexpression affects heart and fin development in a dose-dependent way. Analysis of 72 hpf Tg(Myl7:EGFP) embryos injected with CDS or CDS+UTR mRNA of s1pr1at the reported doses (pg). The percentage of embryos with the indicated heart (A) or pectoral fin (D) defects was averaged across multiple independent experiments carried out in double blind. The total number of analyzed embryos were as follows: RFP mRNA injected n = 185 (50 pg), n = 138 (100 pg), n = 89 (200 pg); s1pr1CDS mRNA injected n = 195 (50 pg), n = 199 (100 pg), n = 106 (200 pg); s1pr1 CDS+UTR mRNA injected n = 214 (50 pg), n = 198 (100 pg), n = 96 (200 pg). For all tested doses, differences between control and s1pr1 injected embryos were significant (Fisher's test P < 0.0001) with the only exception of the 50 pg mRNA CDS+UTR which was not significant. (B,C,E) Images representative of the different phenotypes. In (B), the red dashed arrows emphasize the valve orientation as indicator of correct looping. In (C) an example of cardia bifida phenotype is shown. In (E) the yellow arrow indicates the absence of fins, the green arrows indicate WT fins and the pale green arrow points to an example of defective fin. V, ventricle; a, atrium. Red scale bar = 100 μm. |
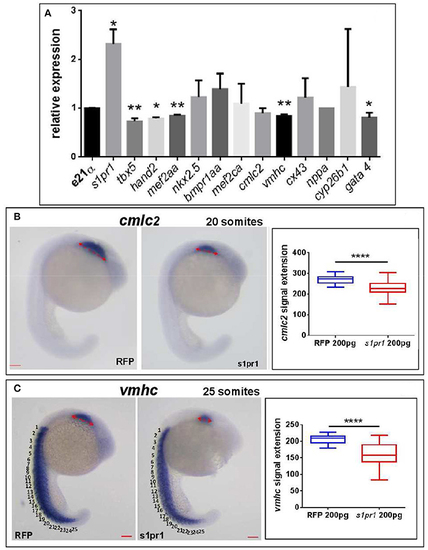
s1pr1 overexpression significantly affects the expression of cardiac precursors and some cardiac regulators. One cell stage embryos were microinjected with 200 ng of the CDS mRNA of s1pr1 or RFP. (A) 48 h after microinjection 20–30 hearts for each experiment were dissected as described in Materials and Methods section. Total RNA was extracted, reverse-transcribed and Q-RT PCR performed. Data were normalized using ef1α as internal standard and are relative to values of hearts from RFP injected embryos. Three different experiments starting from 3 different clutches were used for this analysis.*P < 0.05, **P < 0.001. (B,C) cmlc2 (B) and vmhc (C) ISH were performed on 20 (A) and 25 (B) somite stage embryos. Left side, examples of ISH: double head arrows indicate the extension of the hybridization signals. Scale bar = 100 μm. Right side shows the quantifications of the hybridization signals: the arrow lengths in μm are reported. About 40 embryos were analyzed for each experiment. ****P < 0.0001. |
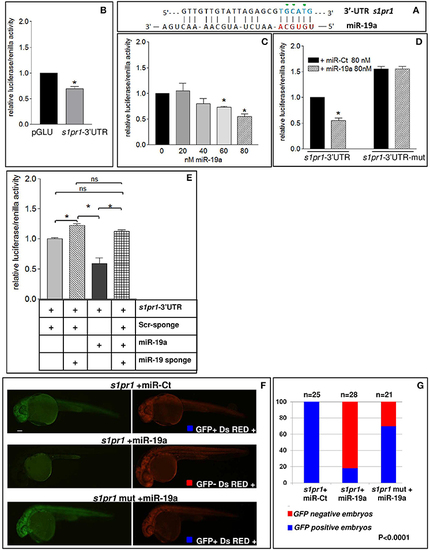
s1pr1 is a direct target of miR-19a. (A) The computational alignment of a potential target site of miR-19a in s1pr1 of Danio rerio. The green dots indicate the bases mutated to destroy the seed sequence binding in the s1pr1-3′UTRmut construct. (B–E) The 3′UTR of dre-s1pr1 was cloned in the pGLU Dual-luciferase reporter plasmid (s1pr1-3′UTR) and transiently transfected into HK293 cells together with the Renilla luciferase pRL–TK vector as internal standard. The luciferase activity of s1pr1-3′UTR was compared: (B) with the luciferase activity of the empty vector; (C) in the presence of increasing amounts of miR-19a mimic; (D) with the luciferase activity of s1pr1-3′UTRmut (containing the s1pr1 3′UTR mutated in the seed match for miR-19a) in the presence of 80 nM of miR-19a mimic; (E) in the presence of 80 nM of miR-19a mimic and 500 pg of a sponge for miR-19a or 500 pg of a scrambled sponge. In each transfection the total amount of the transfected miRNA was kept constant by adding a scrambled miRNA (miR-Ct) to the specific miRNA to obtain 80 ng. *p < 0.05. (F,G) miR-19a negatively regulates the sensor s1pr1-GFP containing the wt3′UTR of s1pr1 downstream the GFP sequence but it is inefficient on the mut s1pr1-GFP; (F) representative 24 hpf embryos injected with wtor mut sensor mRNAs, miR-19a or miR-Ct mimics and DsRED mRNA. Left, miR-19a presence reduces the embryo specific fluorescence in the presence of wt3′UTR of s1pr1 and only the yolk autofluorescence is visible; right, DsRED expression is constant in all the experiment (G) quantification of the in vivo sensor assay. About 20 embryos were analyzed for each experiment. |
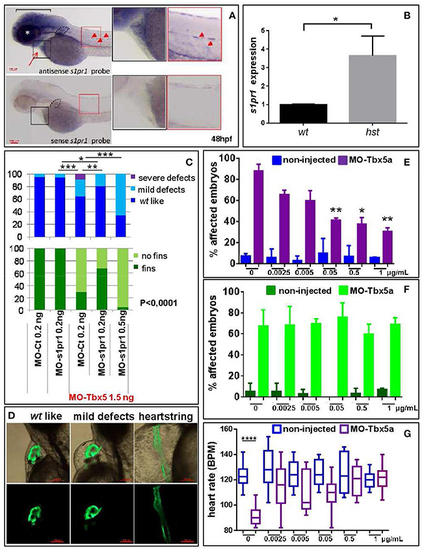
s1pr1 is overexpressed in zebrafish HOS hearts and its downregulation is able to partially rescue heart/fin defects induced by Tbx5 depletion. (A) Examples of s1pr1 ISH performed on 48 hpf embryos. Top left, arrow and arrowheads indicate respectively the hybridization signals at the heart and vascular levels; dotted line encircles fin bud, bracket and asterisk mark respectively the hybridization signal on brain and eye areas Bottom left, control ISH performed with sense s1pr1 probe. Right, magnifications of the cardiac and dorsal areas. Scale bar = 100 μm. (B) Quantification by ddPCR of s1pr1 transcript in hearts dissected from 72 hpf normal and tbx5a296 mutant embryos. Data were normalized on ef1α as internal standard and are relative to wt sets as 1. Three different experiments starting from 3 different clutches were used for this analysis. (C,D) Rescue of Tbx5 morphants by s1pr1 depletion. (C) Analysis of 72hpf Tbx5 morphants. MO-s1pr1 or MO-Ct at the reported doses, were co-injected with 1.5 ng of MO-Tbx5a in Tg(Myl7:EGFP)embryos. For comparison the phenotypes of embryos injected only with MO-s1pr1 or MO-Ct are presented. The percentage of embryos with the indicated heart (top) or pectoral fin (bottom) defects was averaged across multiple independent experiments carried out in double blind. All the comparisons indicated in the heart graph were highly significant in fin graphs (P < 0.0001). The total number of analyzed Tbx5 morphant embryos were as follows: MO-Ct co-injected n = 136 (0.2 ng), n = 137 (0.5 ng); MO-s1pr1 co-injected n = 136 (0.2 ng), n = 203 (0.5 ng). One hundred and fifty embryos were injected only with MO-Ct and 50 only with MO-s1pr1. (D) Some examples of the different cardiac phenotypes obtained in the experiments presented in (C). *p < 0.05, **P < 0.001, ***P < 0.0001. (E–G) Rescue of Tbx5 morphants by s1pr1 chemical inhibition. 2.5 ng of MO-Tbx5a was injected into Tg(Myl7:EGFP)embryos. At 24 hpf, W146 was added at the indicated doses to E3 medium of morphants and non-injected embryos. (E) Cardiac morphology analysis of 72 hpf Tbx5a morphants and non-injected embryos. Affected embryos either had heartstrings morphology, pericardial edema, or looping/chamber defects. The total number of analyzed Tbx5 morphant embryos were as follows: 0 μg n = 51, 0.0025 μg n = 32, 0.005 μg n = 27, 0.05 μg n = 29, 0.5 μg n = 34, 1 μg n = 32. The total number of analyzed non-injected control embryos were as follows: 0 μg n = 28, 0.0025 μg n = 38, 0.005 μg n = 30, 0.05 μg n = 31, 0.5 μg n = 31, 1 μg n = 34. *P < 0.05, **P < 0.001 vs. morphants with 0 μg/mL W146. None the non-injected control embryos treated with W146 showed any significant differences compared to embryos receiving 0 μg/mL W146. (F) Fin analysis of 72 hpf Tbx5a morphants and non-injected embryos. Fins were scored for the presence of both pectoral fins. No statistical differences were observed among drug application groups for either non-injected and Tbx5 morphant embryos, compared to no drug controls. (G) Heart rate analysis of 72 hpf Tbx5a morphants and non-injected embryos. Ten embryos were scored for each group as described in section Materials and Methods. EXPRESSION / LABELING:
PHENOTYPE:
|

s1pr1 downregulation has a small impact on heart development. (A) Analysis of 72hpf Tg(Myl7:EGFP) embryos injected with MO-s1pr1 or MO-Ct at the reported doses (ng). The percentage of embryos with the indicated heart defects was averaged across multiple independent experiments carried out in double blind. The total number of analyzed embryos were as follows: MO-Ct (0,2ng) n=152, MO-s1pr1 (0.2ng) n=146, MO-Ct (1ng) n=101, MOs1pr1 (1 ng) n=117. T-test p= 0,014. (B) images are representative of hearts showing an enlarged atrium as a consequence of 1 ng MO-s1pr1 injection. Spotted lines highlight the atrium shape. V= ventricle A= atrium .Red scale bar = 100μm. PHENOTYPE:
|