
- Title
-
In Vivo Ribbon Mobility and Turnover of Ribeye at Zebrafish Hair Cell Synapses
- Authors
- Graydon, C.W., Manor, U., Kindt, K.S.
- Source
- Full text @ Sci. Rep.
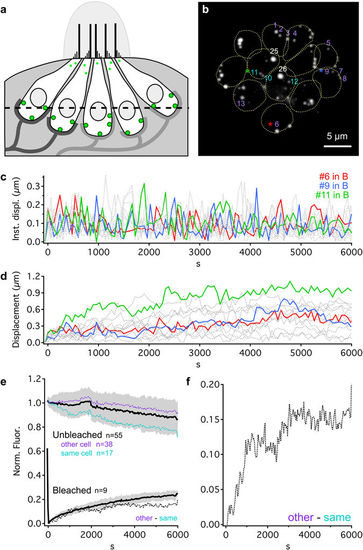
Long term tracking of ribbon movements, Ribeye turnover and exchange. (a) Schematic cross-section of a Ribeye b-EGFP neuromast, showing five hair cells contacted by nerve fibers at ribbon synapses (green). Some small Ribeye aggregates accumulate at the apical surface of the hair cells - these were excluded from analysis. The dotted line corresponds to the imaging plane shown in b. (b) Example maximum intensity projection of a whole Ribeye b-EGFP neuromast (top-down view). Numbers indicate specific ribbons, spread across the neuromast, used for analysis in c–f. Dotted: cell outlines. Colors correspond to c–f. Ribbons “25” and “26” were bleached (white). (c) Instantaneous displacements calculated for movements made between image acquisitions (~1 min interval) for the length of our experiments. Red, blue, and green traces correspond to ribbons (labeled with *) in b. Other labeled ribbons in b are dashed gray. (d) Same ribbons as c, showing accumulated X-Y displacements through time. (e) Normalized average fluorescence intensity through time following bleaching of whole ribbons (bold black ± SD in gray). Unbleached ribbons were sorted as either 1) in the same cell as a bleached ribbon (teal) or, 2) in a cell with no bleached ribbons (purple). Dashed black line: difference between “same cell” and “other cell” lines. (f) Zoomed view of difference between “same cell” and “other cell” lines from e. See also Supplementary Fig. S1. |
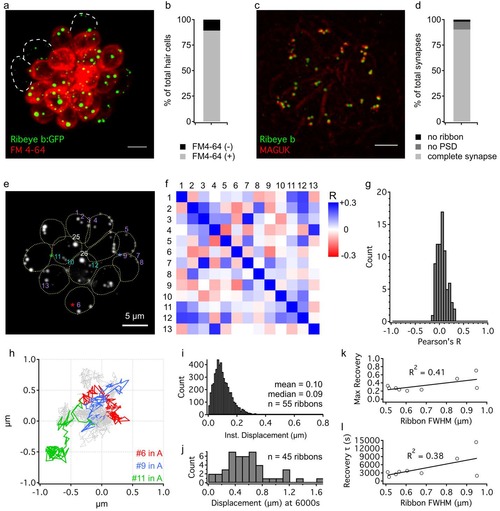
Tracking hair cell ribbon positions over long time scales. a) Example neuromast showing cytoplasmic labeling of ribeye b-GFP hair cells following bath application of FM4- 64 (red) to indicate cells competent for mechanotransduction. Unlabeled hair cells are outlined with dashed lines. b) Quantification of the number of hair cells that label with FM4-64. n= 176 hair cells from 4 fish. c) Example neuromast with antibody labeling of Ribeye b (green) and the postsynaptic marker MAGUK (red). d) Quantification of the number of hair cell ribbons with postsynaptic (MAGUK) elements. n= 388 complete or partial synapses. e) Example neuromast with ribbons numbered (same as Fig. 1b). f) Plot of Pearson’s correlation coefficients between ribbons numbered in e, color coded with positive correlations in blue and negative correlations in red. g) Distribution of all correlation coefficients plotted in e. h) x-y displacements through time for numbered ribbons in e and f (each ribbon started at 0,0 at time 0s). i) Distribution of instantaneous displacement values calculated for each ribbon at each time point. j) Distribution of final displacements after 6000s for all ribbons tracked in four separate experiments (n=45 ribbons). k) Plot of the maximum recovery (from exponential fit of FRAP data) against the diameter (FWHM) of the bleached ribbon (n=9). Linear fit shown with coefficient of determination (R2). l) Plot of the recovery time constant τ (from exponential fit of FRAP data) against the diameter (FWHM) of the bleached ribbon (n=9). Linear fit shown with coefficient of determination (R2). |