
|
Fig. S1
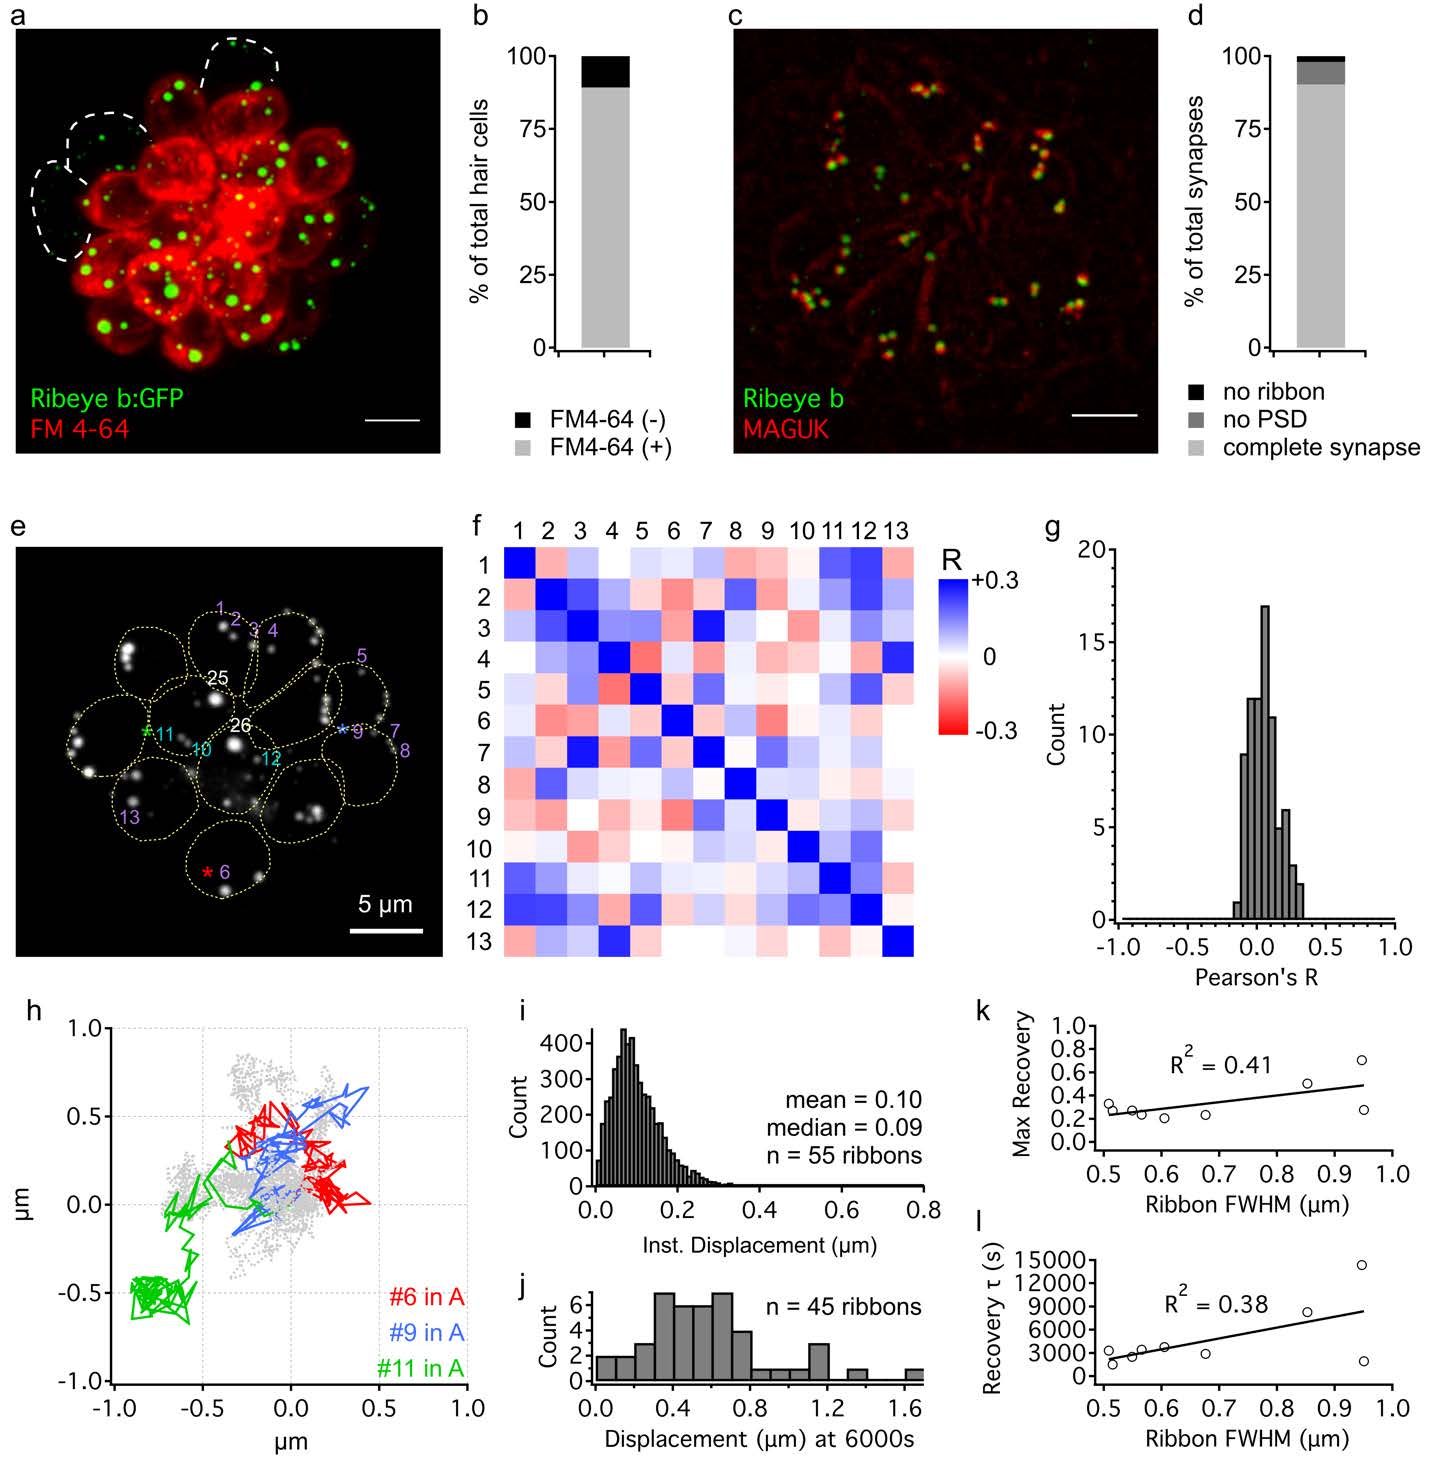
Tracking hair cell ribbon positions over long time scales.
a) Example neuromast showing cytoplasmic labeling of ribeye b-GFP hair cells following bath application of FM4- 64 (red) to indicate cells competent for mechanotransduction. Unlabeled hair cells are outlined with dashed lines.
b) Quantification of the number of hair cells that label with FM4-64. n= 176 hair cells from 4 fish.
c) Example neuromast with antibody labeling of Ribeye b (green) and the postsynaptic marker MAGUK (red).
d) Quantification of the number of hair cell ribbons with postsynaptic (MAGUK) elements. n= 388 complete or partial synapses.
e) Example neuromast with ribbons numbered (same as Fig. 1b).
f) Plot of Pearson’s correlation coefficients between ribbons numbered in e, color coded with positive correlations in blue and negative correlations in red.
g) Distribution of all correlation coefficients plotted in e.
h) x-y displacements through time for numbered ribbons in e and f (each ribbon started at 0,0 at time 0s).
i) Distribution of instantaneous displacement values calculated for each ribbon at each time point.
j) Distribution of final displacements after 6000s for all ribbons tracked in four separate experiments (n=45 ribbons).
k) Plot of the maximum recovery (from exponential fit of FRAP data) against the diameter (FWHM) of the bleached ribbon (n=9). Linear fit shown with coefficient of determination (R2).
l) Plot of the recovery time constant τ (from exponential fit of FRAP data) against the diameter (FWHM) of the bleached ribbon (n=9). Linear fit shown with coefficient of determination (R2).