
Fig. 1
- ID
- ZDB-FIG-180123-25
- Publication
- Graydon et al., 2017 - In Vivo Ribbon Mobility and Turnover of Ribeye at Zebrafish Hair Cell Synapses
- Other Figures
- All Figure Page
- Back to All Figure Page
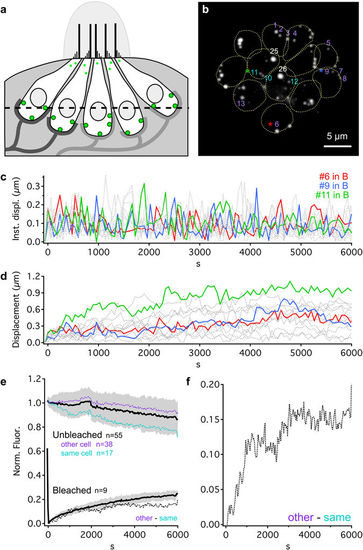
Long term tracking of ribbon movements, Ribeye turnover and exchange. (a) Schematic cross-section of a Ribeye b-EGFP neuromast, showing five hair cells contacted by nerve fibers at ribbon synapses (green). Some small Ribeye aggregates accumulate at the apical surface of the hair cells - these were excluded from analysis. The dotted line corresponds to the imaging plane shown in b. (b) Example maximum intensity projection of a whole Ribeye b-EGFP neuromast (top-down view). Numbers indicate specific ribbons, spread across the neuromast, used for analysis in c–f. Dotted: cell outlines. Colors correspond to c–f. Ribbons “25” and “26” were bleached (white). (c) Instantaneous displacements calculated for movements made between image acquisitions (~1 min interval) for the length of our experiments. Red, blue, and green traces correspond to ribbons (labeled with *) in b. Other labeled ribbons in b are dashed gray. (d) Same ribbons as c, showing accumulated X-Y displacements through time. (e) Normalized average fluorescence intensity through time following bleaching of whole ribbons (bold black ± SD in gray). Unbleached ribbons were sorted as either 1) in the same cell as a bleached ribbon (teal) or, 2) in a cell with no bleached ribbons (purple). Dashed black line: difference between “same cell” and “other cell” lines. (f) Zoomed view of difference between “same cell” and “other cell” lines from e. See also Supplementary Fig. S1. |