
- Title
-
The basal transcription complex component TAF3 transduces changes in nuclear phosphoinositides into transcriptional output
- Authors
- Stijf-Bultsma, Y., Sommer, L., Tauber, M., Baalbaki, M., Giardoglou, P., Jones, D.R., Gelato, K.A., van Pelt, J., Shah, Z., Rahnamoun, H., Toma, C., Anderson, K.E., Hawkins, P., Lauberth, S.M., Haramis, A.P., Hart, D., Fischle, W., Divecha, N.
- Source
- Full text @ Mol. Cell
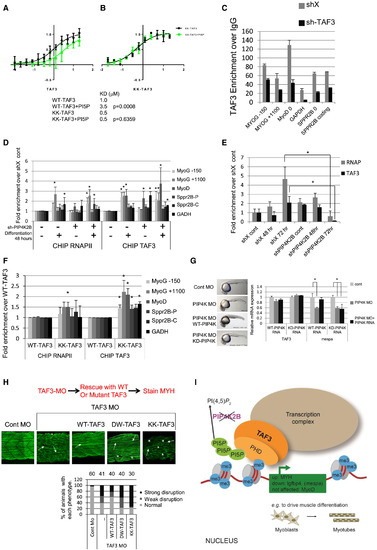
PI Modulates the Interaction of TAF3 PHD Finger with H3K4me3 and the Role of a Conserved PIP4K/PI5P/TAF3 in Zebrafish (A and B) Interaction of increasing concentrations of WT-TAF3 (A) and KK-TAF3 (B) PHD finger with fluorescent H3K4me3 peptide in the absence (black line) and presence (green line) of PI5P. The table indicates apparent KD values for the interactions. PI5P significantly (p = 0.0008) changed the KD of the interaction of WT-TAF3 but not KK-TAF3 PHD finger with H3K4me3 peptide. (C) TAF3 ChIP analysis at the genes indicated of shX or sh-TAF3 C2C12 cells. The data are shown as enrichment over the IgG control and represent the mean of triplicates + SD. (D) RNAPII and TAF3 ChIP analysis at the genes indicated of control (−) or sh-PIP4K2B (+) cells before and after differentiation for 48 hr. Data are presented as mean +SEM (RNAPII n = 5 and TAF3 n = 2). The data were analyzed by a one way ANOVA with a post Hoc Dunnets test to compare conditions to the control sample (undifferentiated SHX). ∗p < 0.05. (E) RNAPII and TAF3 ChIP analysis at the promoter of the MYH gene of shX or shPIP4K2B C2C12 cells before and after differentiation for 48 hr and 72 hr. Data are presented as means +SEM (n = 2). Data are presented as mean +SEM (RNAPII n = 5 and TAF3 n = 2). The data were analyzed with one-way ANOVA. ∗p < 0.05. (F) C2C12 cells depicted in Figure 6A were analyzed by ChIP for the presence of RNAPII and TAF3 at the genomic regions indicated after differentiation for 48 hr. The data are fold changes over the WT-TAF3 sample and are presented as means +SEM (n = 2). The data were analyzed with one-way ANOVA. ∗p < 0.05. (G) Zebrafish embryos injected with control MO or PIP4K targeting MO. PIP4K MO injected embryos were also co-injected with RNA encoding the wild-type human PIP4K2A (WT-PIP4K) or the kinase inactive enzyme (KD-PIP4K). Embryos were collected 24 hr post-fertilization. Left: representative images are shown. Right: QRT-PCR analysis of mRNA isolated from injected embryos for TAF3 or mespa (a direct TAF3 target) expression. The data represent fold changes compared to control and represent the mean of triplicates +SD, and were normalized to GAPDH. (H) Zebrafish embryos injected with control MO or TAF3 targeting MO. TAF3 MO injected embryos were also co-injected with RNA encoding human WT-TAF3, or mutant TAF3 constructs unable to interact with PI (KK-TAF3) and methylated histone H3 (DW-TAF3). Embryos were collected 24 hr post-fertilization and stained using F59 (MYHC). Representative images of the disruption of the myosin filament architecture by the indicated injections are shown. The severity of the phenotypes was categorized into strong and weak and presented graphically. The number of injected embryos is indicated above each graph. (I) Schematic showing that interaction of TAF3 with nuclear PI regulated by PIP4K2B modulates transcriptional output. PIP4K2B phosphorylates and regulates the levels of nuclear PI5P and a small pool of PI(4,5)P2. Knockdown of PIP4K2B increases PI5P levels that interact with and regulate TAF3 transcriptional complexes. PI interaction with TAF3 can lead to both upregulation and downregulation of specific genes, which eventually affects cell fates such as myoblast differentiation. See also Figure S7. |
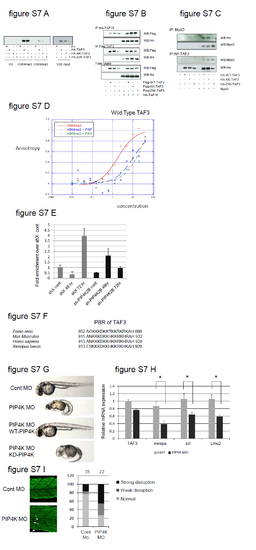
Related to Figure 7. A. HEK293 cells were transfected with TAF3 PHD finger constructs indicated (right) and lysates were used for affinity chromatography with beads coupled to unmodified histone H3 peptide (H3) or modified by trimethylation at lysine 4 (H3K4me3) or at lysine 9 (H3K4me3). Bound proteins were separated by SDS-PAGE and assessed by immunoblotting using an anti-HA antibody. The right panel depicts the input of the various TAF3 proteins. B. HEK293 cells were transfected as indicated (bottom) and then immunoprecipitated with the antibodies indicated on the left and bound proteins were assessed using SDS-PAGE and immunoblotting with the antibodies indicated on the right. The lower panel shows the expression of the various proteins in the input lysates. C. HEK293 cells were transfected as indicated (bottom) and immunoprecipitated with the antibodies shown on the left. Bound proteins were assessed by SDS-PAGE and immunoblotting with the indicated antibodies (right). D. Increasing concentrations of WT-TAF3 PHD finger was assessed for its interaction with fluorescent H3K4me3 peptide in the absence (red line) and presence of PI5P (blue line) and PI(4,5)P2 (green line). The data demonstrate that both PI5P and PI(4,5)P2 decrease the interaction between TAF3-PHD finger and H3K4me3. E. TAF3 Chip analysis at the promoter of the MYOG gene of shX or sh-PIP4K2B C2C12 cells before and after myoblast differentiation for 48h or 72h. The data is represented as fold enrichment over the shX control and are mean+SEM (n=2). F. An alignment showing the strong evolutionary conservation of the PBR of the TAF3 PHD finger from various organisms. G. Zebrafish embryos were injected with either a control morpholino (MO) or a PIP4K targeting morpholino (PIP4K MO) with or without RNA encoding the wild type human PIP4K2A (WT-PIP4K) or the kinase inactive enzyme (KD-PIP4K) and were collected 48h post fertilisation. PIP4K MO induces a developmental phenotype observed in approximately 70% of fish. The rescue was observed in 80% of injected fish with WT-PIP4K RNA but only in approximately 10% injected with the mutant kinase inactive PIP4K RNA. H. Control zebrafish embryos (cont) or embryos injected with 3.5ng PIP4K MO were collected 24h post fertilisation and assessed for the expression of the TAF3 dependent transcription factor mespa and for direct Mespa downstream gene targets scl and lmo2. The data represent fold changes compared to the control samples and represent the mean +SD of triplicates. The data were normalised to the housekeeping gene GAPDH. I. Zebrafish embryos were injected with a control- or PIP4K MO. Embryos were collected 24h post fertilisation and stained using F59 (MYHC). Representative images of the disruption of the myosin filament architecture by the indicated injections are shown. The severity of the phenotypes were categorised into strong and weak and presented graphically. The number of injected embryos is indicated above the graph. |