
- Title
-
Afferent Connectivity of the Zebrafish Habenulae
- Authors
- Turner, K.J., Hawkins, T.A., Yáñez, J., Anadón, R., Wilson, S.W., Folgueira, M.
- Source
- Full text @ Front. Neural Circuits
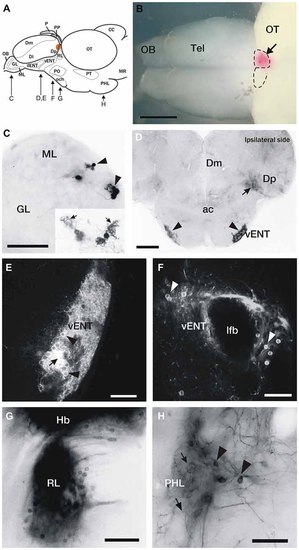
DiI labeling of connections of the habenula in adult zebrafish. (A) Brain schematic showing the levels of sections in (C-H). Images are dorsal view of whole brain with anterior to the left (B) or transverse sections (C-H) through the brain of adult zebrafish after DiI application to the left or right habenula (orange area in A and pink in B). (B) Location of a typical DiI application into the right habenula (arrow). Dotted lines mark the limits of both habenulae. (C) Labeled mitral cells located in the dorsomedial region of the mitral cell layer in the olfactory bulb (arrowheads). Level of this section corresponds to Figure 2A. Inset: Detail of two mitral cells, showing characteristic dendritic arbors (arrows). (D) Labeled cells located bilaterally in the ventrolateral telencephalon (vENT, arrowheads) and neuropil formed by mitral cell collaterals in Dp (arrow). Note that although the vENT is labeled bilaterally, the ipsilateral nucleus (right) is more intensely labeled. Level of this section corresponds to Figure 2C. (E,F) Confocal images of the cells located in the vENT. At rostral levels (E), small neuronal cell bodies (arrowheads) are densely distributed among a dense network of cell processes (arrow; this level of the nucleus corresponds to Figure 2C). At caudal levels (F), more sparsely distributed neurons (arrowheads) surround the lateral forebrain bundle (this level of the nucleus corresponds to Figure 2D). (G) Labeled cells in a nucleus located in the prethalamus that may be the rostrolateral nucleus (this section corresponds to level represented in Figure 2E). (H) Labeled neurons (arrowheads) and beaded axons (arrows) located in the posterior hypothalamic lobe (this section corresponds to level shown Figure 2G). Scale bars: 500 µm in (B), 50 µm in (C,E,F,H) and 100 µm in (D,G). |
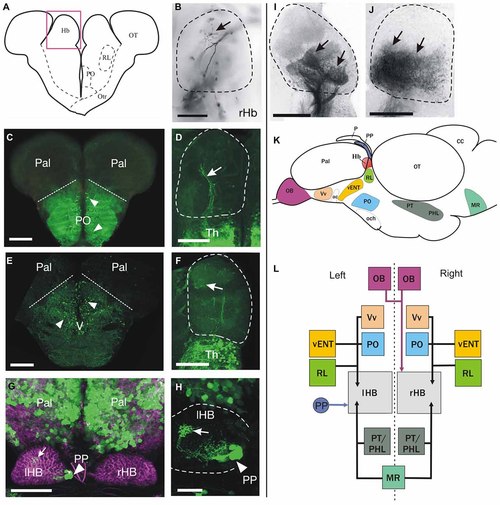
Cell populations projecting to the habenula identified by anterograde DiI labeling and/or transgene expression. (A-J) Schematic of a transverse section on the brain at the level of the habenulae (A). The pink box approximates the area shown in (B,D,F,I,J). Images are from transverse sections (B-F,I-J) or dorsal views with anterior to the top (G,H) of zebrafish brains. Dotted lines in (B,D,F,H-J) mark the limits of the habenula. Images are of adult brains unless otherwise stated. (B) Labeled fibers (arrow) dorsally in the right habenula after DiI application in the olfactory bulb. (C) GFP+ neurons (arrowheads) in preoptic areas of a Tg(isl1:GFP)rw0 fish. Dotted lines mark the approximate limit between preoptic areas (ventral) and pallium (dorsal). (D) Sparse GFP+ fibers in the right habenula (arrow) of an adult Tg(isl1:GFP)rw0 fish. (E) GFP+ neurons (arrowheads) in the subpallium of a Tg(1.4dlx5a-dlx6a:GFP)ot1 fish. Dotted line marks the approximate pallial-subpallial boundary. (F) Very few GFP+ fibers (arrow) in the habenula of a Tg(1.4dlx5a-dlx6a:GFP)ot1 fish. (G) GFP expression (green) in 1 month old (1mpf) Et(gata2:GFP)bi105 juvenile zebrafish counter stained against tubulin (magenta) showing GFP+ neurons in the pallium and parapineal (PP, arrowhead). Note that the parapineal sends axons that terminate in the left habenula (arrow). Image is a dorsal view, anterior to the top. (H) High magnification image of the left habenula shown in G (after subtracting tubulin channel) showing that GFP+ fibers in the habenula (arrow) originate from the parapineal (PP, arrowhead). (I) Confocal image of the habenula showing labeled fibers (arrows) in the habenula after DiI application to the rostral vENT. Although more intense labeling is observed in ventral regions of the habenula, precise habenula subnuclei could be delineated using this method. (J) Labeled fibers (arrows) in the ventral half of the habenula after DiI application to the posterior hypothalamic lobe. (K,L) Schematics showing a summary of the main afferent areas to the habenula (K: outline of the brain in lateral view, L: boxes diagram). (K) The brain nuclei that project to the habenula are shown as colored areas. (L) Boxes represent main nuclei projecting to the habenula, while arrows represent projections. Asymmetric projection from the parapineal (PP) to left habenula (lHB) is shown with a blue arrow. Asymmetric projection from mitral cells of the olfactory bulbs (OB) to right habenula (rHB) is shown with a pink arrow. All other afferent areas that seem to innervate both left and right habenula are represented with black arrows. Scale bars: 150 µm in (B-F,I-J); 100 µm in (G), 50 µm in (H). |
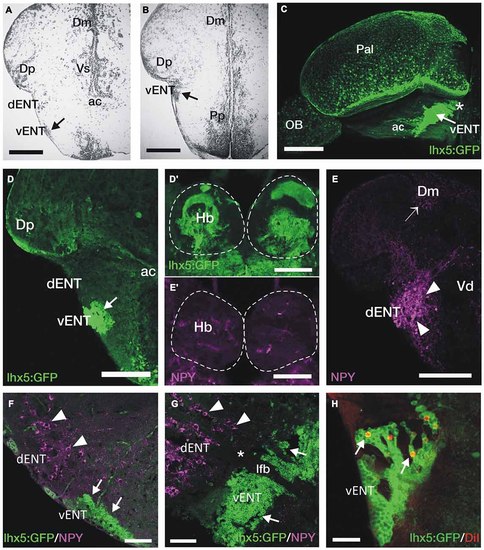
GFP+ vENT neurons and habenular innervation in Tg(lhx5:GFP)b1205 transgenic zebrafish. Images are transverse sections (A,B,D-F,H), lateral view (C) or parasagittal section (G) of adult zebrafish wild type (A,B,E,E′) or Tg(lhx5:GFP)b1205 (C-D′,F-H) brains. (A,B) Nissl stained sections showing the cytoarchitecture of the vENT (arrows in A and B) and dENT at anterior (same level as shown in schematic Figure 2C) and posterior (same level as shown in schematic Figure 2D). By following serial sections it can be noted that only the vENT extends into caudal areas of the telencephalon (arrow in B). (C) Lateral view of intact brain from a Tg(lhx5:GFP)b1205 fish (anterior to the left) showing GFP+ cells in the vENT (arrow), among other structures and areas. Note that vENT cells form a band extending from the level of the anterior commissure (ac) into the telencephalic peduncule (indicated with a star). (D) GFP+ cells in the vENT (arrow), but not in the dENT, of a Tg(lhx5:GFP)b1205 fish. (D′) Dense neuropil of GFP+ fibers in the habenula of a Tg(lhx5:GFP)b1205 fish. Dotted lines mark the habenulae. (E) NPY+ cells in the dENT and fibers (arrowheads) in the medial area of the pallium (Dm; arrow). (E′) Very few NPY+ fibers are found in the habenulae. Note that some of the labeling observed in the image is caused by autofluorescence of blood vessels. (F,G) Double immunohistochemistry against NPY and GFP in transverse (F) and parasagittal (G; anterior to the left) sections of a brain from a Tg(lhx5:GFP)b1205 fish. Note that NPY+ cells are restricted to the dENT (arrowheads). GFP+ cells were observed in the vENT (arrows). Note in (G) that the dENT (arrowheads) does not extend as far caudal as the vENT (arrows) and there is a clear gap (star) between the two nuclei. Bundles of axons from the lateral forebrain bundle (lfb) travel through both nuclei. (H) Retrogradely DiI labeled cells (arrows) in the vENT of a Tg(lhx5:GFP)b1205 fish after tracer application to the habenula. Scale bars: 150 µm in (A,B,D-E′); 250 µm in (C); 100 µm in (F,G) and 50 µm in (H). |
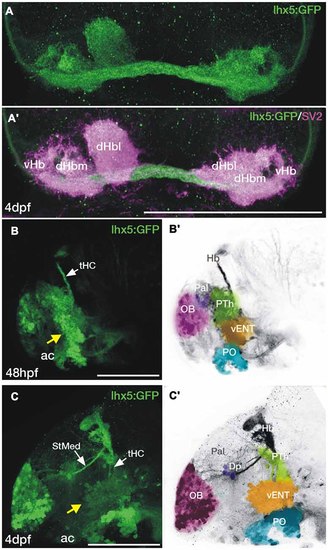
Transgene expression in the forebrain of Tg(lhx5:GFP)b1205 embryos and larvae. (A,A′) Dorsal views of the habenula of a 4dpf Tg(lhx5:GFP)b1205 fish labeled with anti-GFP only (A) or anti-GFP (green) and anti-SV2 (magenta) antibodies (A′). GFP+ axon terminals (green) innervate all habenula neuropil domains visualized with SV2 (magenta). (B-C′) Lateral views of the forebrain of a Tg(lhx5:GFP)b1205 fish at 48 hpf (B,B′) and 4dpf (C,C′). (B) GFP+ cells and processes in 48 hpf Tg(lhx5:GFP)b1205. Note that the tract of the habenular commissure is labeled at this stage (tHC, white arrow). Yellow arrow points to putative prethalamic eminence/vENT. (B′) Image shown in (B) has been converted to gray scale and false colored areas show the different presumptive domains. GFP+ cells and processes form a continuous band at the telencephalic-diencephalic boundary (B), extending from presumptive prethalamus (PTh, labeled in green), through the putative prethalamic eminence/vENT (vENT, labeled in yellow) and preoptic regions (PO, labeled in blue). A number of GFP+ neurons are also present in the olfactory bulb (OB, labeled in pink). (C) GFP+ cells and processes in 4dpf Tg(lhx5:GFP)b1205 fish. Note that at this stage the main afferent tracts to the habenula, the stria medullaris (StMed) and the tract of the habenular commissure (tHC) are visible. Yellow arrow points to putative prethalamic eminence/ vENT. (C′) Image shown in (C) has been converted to gray scale and false colored areas show the different presumptive domains. There are a number of GFP+ cells rostrally in the OB (pink area), a few GFP+ cells and fibers in Dp (purple). Prethalamus, vENT and preoptic regions are again labeled in green, yellow and blue respectively. Scale bars: All 100 µm. |
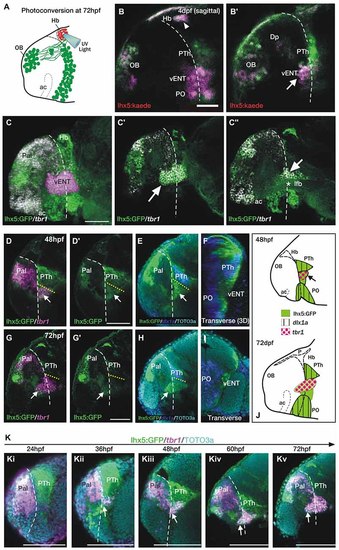
The telencephalic vENT is a major source of habenula afferents, is diencephalic in origin and originates from the prethalamic eminence. The vENT projects to the habenula. (A) Schematic summarizing experimental setup. Habenula neuropil of 72 hpf Tg(lhx5:Kaede)b1204 was photoconverted with a cone of UV light. Photoconversion was made with a lateral approach in order to avoid conversion of areas ventral to the habenula. (B,B′) Lateral views of single Z-slices of Tg (lhx5:Kaede)b1204 larvae (B′ is closer to the midline) imaged at 4dpf after photoconversion of the habenula neuropil at 72 hpf. Dotted line marks the anterior intraencephalic sulcus. Some red Kaede cells (magenta in the figure) are observed in the olfactory bulb (OB) and preoptic region (PO), and a few fibers in Dp. A number of red Kaede cells were observed in the domain identified as presumptive larval vENT (arrow in B′). Note red Kaede fibers at the photoconversion area in the habenula (arrowhead in B). The vENT expresses tbr1 and straddles the telencephalic/diencephalic boundary at 4dpf. (C-C′′) Lateral views of Tg(lhx5:GFP)b1205 inmunostaining against GFP (green) and FISH against tbr1 (grayscale). In C, the vENT has been false colored in pink. Dotted lines on lateral views mark the anterior intraencephalic sulcus, which runs from the optic recess at the base of the optic stalks ventrally to the pallial/diencephalic boundary dorsally. (C) 3D projection of a confocal stack showing tbr1 and GFP co-expression in the putative vENT (false colored in pink to differentiate from pallial and subpallial tbr1a expression). (C′,C′′) Single confocal z-slices at lateral (C′) and medial levels (C′′) showing GFP and tbr1 coexpression in vENT neurons (arrow). Note that the vENT extends from the diencephalon into the telencephalic lobes (dotted line marks the anterior intraencephalic sulcus). At medial levels, the larval vENT surrounds the lateral forebrain bundle (lfb, star in C′′), as has been observed in the adult (see Figure 1F). The vENT is diencephalic in origin and originates from the prethalamic eminence. Lateral (D,E,G,H) and transverse views (F,I) of Tg(lhx5:GFP)b1205 fish labeled with anti-GFP (green) and FISH for tbr1 (pink) (D-D′,G,G′) or dlx1a (blue) (E,F,H,I) at 48 hpf (D-F) and 72 hpf (G-I). All images are single confocal z-slices taken from volumes, anterior to the left. (D-F) Lateral (D,E) and transverse view after 3D rendering (F) of Tg(lhx5:GFP)b1205 48 hpf larva labeled with anti-GFP (green) and FISH for tbr1+ (pink in D) and dlx1a+ (blue in E,F). Dotted yellow line in (D,E) marks the dorsal limit of the tbr1+ domain. (D) A group of GFP and tbr1+ cells (arrow) are situated in the diencephalon, just caudal to the telencephalic/diencephalic boundary. These cells were identified as prethalamic eminence/prospective vENT. (D′) Same image as (D) but only showing GFP expression (green channel). Arrow points to prethalamic eminence/prospective vENT. (E) GFP and dlx1a+ cells in the prethalamus, just dorsal to the prethalamic eminence/prospective vENT (arrow). (F) Transverse section shows the relative mediolateral position of the prethalamus, vENT and preoptic areas. (G-I) Lateral (G,H) and transverse section (I) of Tg(lhx5:GFP)b1205 72 hpf larva labeled with anti-GFP (green) and FISH for tbr1+ (pink in G) and dlx1a+ (blue in H and I). Dotted yellow line in (D,E) marks the dorsal limit of the tbr1+ domain. (G) The GFP+ vENT expresses tbr1 extends from the ventrolateral telencephalon to the rostral diencephalon (arrow points to the rostral portion of the vENT, dotted yellow line marks the dorsal limit of the tbr1+ domain). (G′) Image shown in (G) showing just GFP expression (green channel). (H) dlx1a+ domain in the prethalamus (PTh), just dorsal to the diencephalic portion of the vENT (arrow points to rostral portion of the vENT, dotted yellow line marks the dorsal limit of the tbr1+ domain in the diencephalon). (I) Transverse section shows the GFP+ vENT (green) laterally located and dlx1a+ PO (blue) areas more medially. (J) Schematic representations of the brain of 48 and 72 hpf larvae showing expression of lhx5:GFP, dlx1a and tbr1 in the prethalamus (PTh), prethalamic eminence (arrow) and preoptic region (PO). Time-series showing the development of the prethalamic eminence that gives rise to the vENT. (K) Time series showing tbr1 expression from 24 to 72 hpf in Tg(lhx5:GFP)b1205. (i) At 24 hpf, there is no tbr1 expression in rostral diencephalon; (ii) At 36 hpf brain, tbr1 expression is observed in a subset of the GFP+ cells in the diencephalon (arrow) close to the the telencephalic/diencephalic boundary (marked by dotted line). These cells are likely to be within the prethalamic eminence/prospective vENT; (iii-v) From 48-72 hpf, vENT cells coexpressing tbr1 and GFP extend into the telencephalic lobes (arrow points to rostral portion of the vENT). Scale bars: (B,C,D′,G′) 50 µm; (K) 100 µm. |
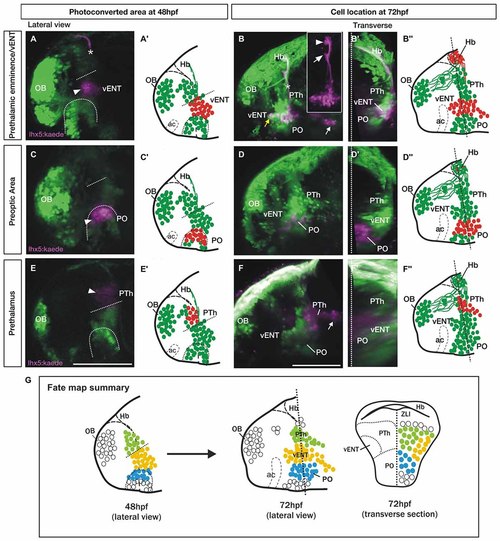
Spatio-temporal fate map of the larval prethalamic eminence/prospective vENT and adjacent areas. Images and accompanying schematics show Kaede photoconversion areas in lateral views of 48 hpf Tg(lhx5:Kaede)b1204 fish (A,A′,C,C′,E,E′) and location of Kaede cells by 72 hpf in lateral view (B-B′′,D-D′′,F-F′′) and transverse sections after 3D rendering (B′,D′,F′). Dotted arch and lines at 48 hpf mark the dorsal limit of the preoptic area and prethalamic eminence respectively. Photoconversion in the prethalamic eminence (n = 8). (A-B′′) Cells were photoconverted from green to red (magenta in the images) at the diencephalic prethalamic eminence of Tg (lhx5:Kaede)b1204 embryos at 48 hpf (arrowhead in A, red cells in schematic A′′) and their location was then imaged by 72 hpf in lateral view (B and red cells in B′′). Note in (A) that area of photoconversion by 48 hpf is located at the level of the tract of the habenular commissure (marked with a star). (B′) is transverse section after 3D rendering. Note that 24 h after photoconversion, red Kaede expressing neurons have expanded from the photoconversion area rostrally into the telencephalon (yellow arrow) and caudally into hypothalamic areas (white arrow). These red Kaede cells send afferent projections to ventral (arrow in B inset) and dorsal halves (arrowhead in B inset) of the habenula and were identified as vENT. Transverse section shows that the vENT occupies a lateral position within the forebrain (B′). Photoconversion in preoptic regions (PO) (n = 9). (C-D′′) Cells were photoconverted in the presumed preoptic area of Tg (lhx5:Kaede)b1204 embryos at 48 hpf (C,C′). Note that 24 h after photoconversion, most red Kaede cells maintain their relative rostro-caudal positions within the telencephalon and diencephalon (D), and are located ventro-medially relative to the vENT when viewed in transverse section (D′). Most conversions of presumptive PO (n = 6/9) did not result in labeling of habenula afferents. Photoconversion of the prethalamus (PTh; n = 3). (E-F′′) Cells were photoconverted in the presumed prethalamic area of Tg (lhx5:Kaede)b1204 embryos at 48 hpf (E,E′). Twenty four hours after photoconversion, most red Kaede cells maintain their positions within the diencephalon and do not expand into the telencephalon (F). A few red Kaede cells expand into caudal areas (white arrow). Transverse section shows that these cells occupy a dorsomedial position (F′). (G) Summary of the results of the fate map experiments with Tg(lhx5:Kaede)b1204, with the areas of Kaede photoconversion in 48 hpf. Open circles denote cells that were not fate mapped. Level of transverse section is shown in the 72 hpf lateral view of the brain. Scale bars: All 100 µm. |
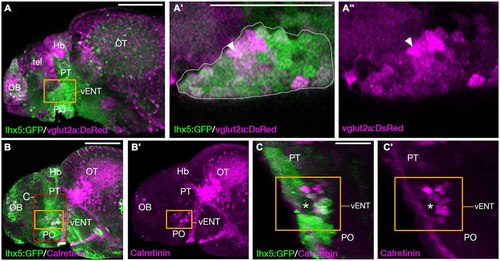
The larval vENT contains glutamatergic and calretinin-positive populations of cells. (A,A3) Confocal images of Tg(lhx5:GFP)b1205/Tg(slc17a6b:DsRed)nns9Tg 4 dpf double transgenic larvae labeled with anti-GFP and anti-DsRed antibodies (green and magenta respectively). GFP expression shows the previously identified vENT (orange box in A, enlarged in A′,A3). Enlarged views of single confocal sections (A′,A3) show co-expression of GFP and DsRed in a subpopulation of cells (arrowheads) of the GFP+ vENT (dotted line in A′ marks). (B-C′) Tg(lhx5:GFP)b1205 4dpf larvae labeled with anti-GFP (green) and anti-calretinin (magenta). (B,B′) lateral view shows a subset of GFP+ vENT neurons (bound by orange box) express calretinin. (C,C′) 3D transverse sections of same larvae (B) cropped to area delineated by red box in (B). Calretinin+ and GFP+ neurons within the vENT, which surrounds the lateral forebrain bundle (lfb; asterisk). Scale bars: (A,B) 100 µm; (A′,C) 50 µm. |