
- Title
-
Endothelial Cords Promote Tumor Initial Growth prior to Vascular Function through a Paracrine Mechanism
- Authors
- Zhao, C., Zhang, W., Zhao, Y., Yang, Y., Luo, H., Ji, G., Dong, E., Deng, H., Lin, S., Wei, Y., Yang, H.
- Source
- Full text @ Sci. Rep.
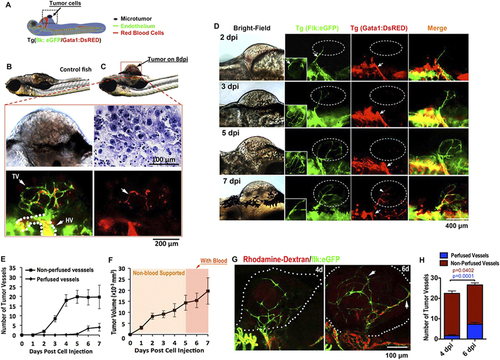
Solid endothelial cords penetrate into microtumor before blood perfusion in a zebrafish xenograft model. (A,B) Green tumor vessels and circulating red blood cells (red panel) in Tg(flk:eGFP; Gata1:dsRed) double transgenic zebrafish with mouse B16 melanoma xenografts. Hematoxylin staining shows the typical cytological features of tumor cells. TV, Tumor Vasculature. HV, Host Vessel. (C,D) Dynamic imaging of endothelial cords penetrate (green) into microtumors before blood perfusion (red). Blood flow (red) is observable in dilated host vessel, but absent in initial angiogenic sprouts (green) in microtumors (dotted circles) until 7dpi. Insets (D, green panels) indicate angiogenic sprouts from the ventral view. (E,F) Quantitative analysis of blood-perfused or non-perfused neovessels (E) and microtumor growth rate (F) in the xenografts (n > 20 for each day, error bars show SEM). (G) Microangiograph by injecting Rhodamine-Dextran (red, 2 million MW) from posterior cardinal vein showing the absence of blood low (red) in solid endothelial cords (green) in 4dpi xenografted microtumors (dotted circles), but present on 6dpi. (H) Quantitative analysis indicates the change of tumor neovessels with or without blood-perfusion on 4dpi and 6dpi (n = 15 for 6dpi, n = 12 for 4dpi, error bars show SEM). |
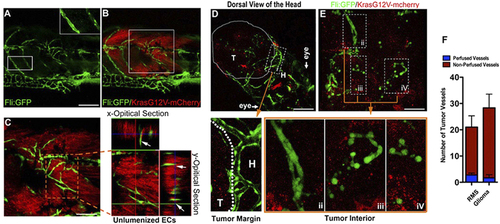
Solid endothelial cords are recruited into the endogenous microtumors in zebrafish. (A,B) Hollow host vessels (inset box) at the margin of endogenous rhabdomyosarcoma (RMS) and solid endothelial cords (green) at the interior of RMS microtumor (red), in a 25d Tg(fli1a1:GFP) zebrafish. (C) 3D projection and optical section images of the interior RMS microtumor (box in C) showing the tumor-recruited solid angiogenic sprouts. (D,E) Endogenous glioma and blood vessels in the head of 9d zebrafish. Hollow host vessels (panel i) in head (H) is morphologically distinct to solid endothelial sprouts or separate ECs in glioma (panels ii, iii, iv). (F) Quantitative analysis of tumor neovessels with or without blood-perfusion in RMS and glioma (n = 3 for RMS, n = 4 for glioma, error bars show SEM). For experimental outline and the resulting RMS and glioma bearing zebrafish, see Fig. S4. |
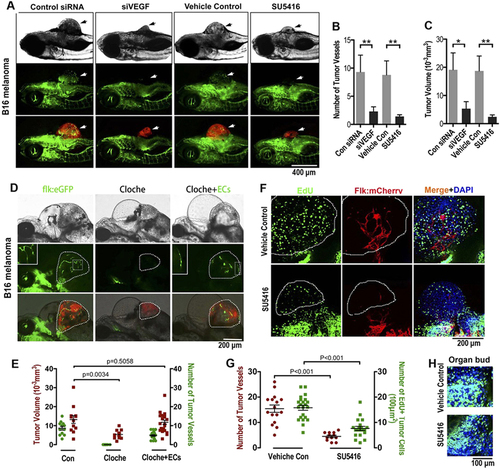
Endothelial cords are required for initial tumor growth in zebrafish. (A) Simultaneous dual fluorescence imaging showing the xenografted mouse melanoma (red) and endothelial cords (green panel, arrows) in 5d Tg(flk:eGFP) transgenic zebrafish using tumor cells transfected with control siRNA or VEGF siRNA, or using zebrafish recipients treated with SU5416 (2 µM) or control vehicle. (B,C) Quantitative analysis of tumor-induced endothelial sprouts and the tumor volume at the day 5 (n > 50 fish for each group; *p < 0.05, **p < 0.01, error bars show SEM). (D) Slower growth of xenografted microtumor (red) in zebrafish cloche mutant is significantly rescued by exogenous ECs (green) sorted from 24 hpf Tg(flk:eGFP) zebrafish. Dotted lines indicate the location of microtumor. (E) Quantitative analysis of tumor-associated endothelial cells and the xenografted microtumor volume (n > 11 fish for each group, error bars show SEM). (F) Number of proliferating tumor cells (EdU+, green) in microtumor in Tg(flk:mCherry) transgenic zebrafish decreased when solid endothelial cords (red) are blocked by SU5416 (2 µM) treatment. Dotted lines indicate the location of microtumors. (G) Quantitative analysis of tumor-associated endothelial cells and the EdU + proliferating tumor cells density (n > 12 fish for each group, error bars show SEM). (H) Cell proliferation in normal developing organ buds is not affected by SU5416 treatment at the same dosage. |
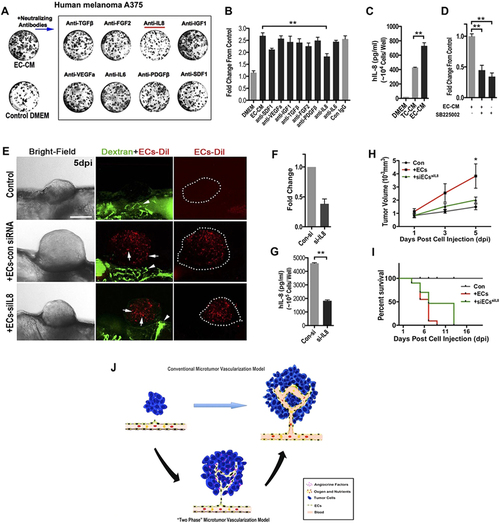
ECs-derived IL-8 mediated the initial growth of A375 micro-xenografts in vitro and in vivo. (A) Representative images of human A375 melanoma clones cultured in phEC-CM supplemented with different neutralizing antibodies for 4 days. (B) Quantitative analysis of the A375 tumor cells in phEC-CM with different neutralizing antibodies. (n = 5 wells for each group). (C) Quantitative analysis of the A375 tumor cells in phEC-CM treated with SB225002 (1 µM, inhibitor of IL-8 receptor CXCR2) inhibitor (n = 5 wells for each group). (D) hIL-8 concentration of DMEM, TC-CM and EC-CM (n = 3 wells for each group). (E) Representative images of A375 xenografts with or without incorparated ECs (Arrows), primary ECs (HUVECs) were pre-stained by CM-Dil, blood flow (Arrowheads) in zebrafish were imaged by FITC-dextran (2 million MW). Dotted lines indicate the location of microtumors. (F,G) Evaluation of IL-8 expression by q-PCR and Elisa at 24 h after ECs was treated by siRNA. (H,I) Quantitative analysis of xenografts growth rate and the survive rate of zebrafish hosts after implanted with A375 tumor cells alone or hECs: A375 cells mixture (1:10). (n > 20 fish for each group). (J) The “two-phase” model of ‘angiogenic switch’. Angiogenic neovessels are conventionally believed infiltrating into the avascular microtumor as circulatory sprouts with blood perfusion. We propose that initial endothelial cords in microtumors remain non-circulatory and drive tumor growth through a paracrine mechanism by releasing endothelium-derived proliferative factors (angiocrine factors), before they support tumor progression by supplying oxygen and nutrients through the blood circulation. |

Penetration of endothelial cords into xenografted microtumor on Tg(flk:eGFP::Gata1:dsRED) double transgenic zebrafish. (A) Real-time observation showing tumor-induced endothelial sprouts (panel t0, arrowhead in magnified image) from the dilated host vessel (arrow in A) on 1dpi are solid and tend to attract each other as they stretching in the microtumor mass. (B) Diagram shows the strategy of establishing the xenograft tumor model by injecting 500-1000 tumor cells besides 48hpf zebrafish common cardinal vein (CCV). |

Lumenization of solid angiogenic sprouts in xenografted microtumor on zebrafish. (A) The coexistence of lumenized and unlumenized angiogenic circuits in xenografted tumors at 8 dpi (days post cell injection). (B) The formation of endothelial lumens via the dynamic fusion of intracellular vacuoles (arrows). (C) Schematic shows the process of endothelial cord lumenization in the xenografted tumor in zebrafish. |
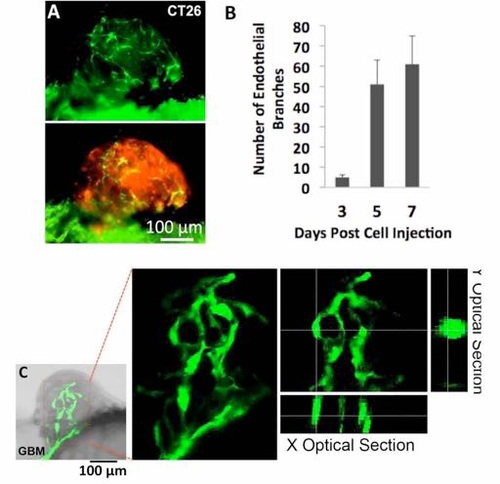
Endothelial cords in xenografted CT26 microtumors and human glioblastoma (GBM) in zebrafish. (A) A CT26 microtumor (red, stained by FAST Dil) with endothelial cords in Tg(flk: eGFP) zebrafish on 6 dpi. (B) Quantitative analysis of the number of endothelial branches in the microtumors with time (>20 for each group, scale bars show SEM). (C) Endothelial cords in human GBM xenograft in zebrafish. |

The strategy for inducing endogenous tumors in Tg(fli:GFP):P53+/- transgenic zebrafish by co-injection of UAS-mCherry-KrasG12V with Rag2- Gal4VP16 for Rhabdomyosarcoma (25dpi), or GFAP-Gal4VP16 for Glioma (9dpi). Phenotypes are shown for each tumor type. |
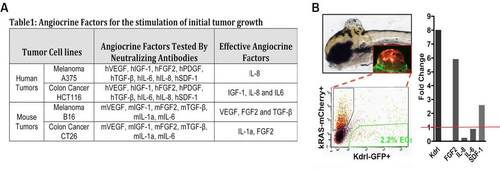
(A) Table 1 summarizes the effective angiocrine factors in the EC-CM identified using neutralizing antibodies. (B) The strategy for isolating the endothelial cells in endogenous zebrafish Glioma microtumors. (L) qPCR quantification of FGF2 and SDF-1 overexpression in the microtumor ECs, using GFP negative cells of the microtumors as control (red line indicates control expression level). (*p < 0.05, **p < 0.01). |