
|
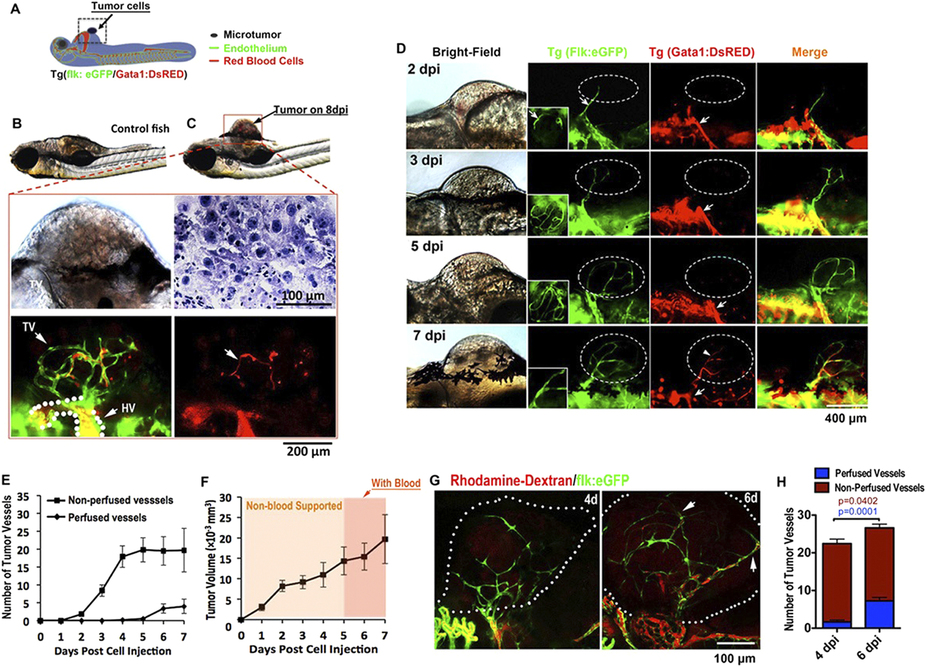
Fig. 1
Solid endothelial cords penetrate into microtumor before blood perfusion in a zebrafish xenograft model.
(A,B) Green tumor vessels and circulating red blood cells (red panel) in Tg(flk:eGFP; Gata1:dsRed) double transgenic zebrafish with mouse B16 melanoma xenografts. Hematoxylin staining shows the typical cytological features of tumor cells. TV, Tumor Vasculature. HV, Host Vessel. (C,D) Dynamic imaging of endothelial cords penetrate (green) into microtumors before blood perfusion (red). Blood flow (red) is observable in dilated host vessel, but absent in initial angiogenic sprouts (green) in microtumors (dotted circles) until 7dpi. Insets (D, green panels) indicate angiogenic sprouts from the ventral view. (E,F) Quantitative analysis of blood-perfused or non-perfused neovessels (E) and microtumor growth rate (F) in the xenografts (n > 20 for each day, error bars show SEM). (G) Microangiograph by injecting Rhodamine-Dextran (red, 2 million MW) from posterior cardinal vein showing the absence of blood low (red) in solid endothelial cords (green) in 4dpi xenografted microtumors (dotted circles), but present on 6dpi. (H) Quantitative analysis indicates the change of tumor neovessels with or without blood-perfusion on 4dpi and 6dpi (n = 15 for 6dpi, n = 12 for 4dpi, error bars show SEM).