
- Title
-
Chevron formation of the zebrafish muscle segments
- Authors
- Rost, F., Eugster, C., Schröter, C., Oates, A.C., Brusch, L.
- Source
- Full text @ J. Exp. Biol.

Trunk and segment morphology of a developing zebrafish embryo. (A–C) Lateral views of a developing zebrafish embryo from a representative time-lapse movie (supplementary material Movie 1). Anterior is to the left. Arrowheads mark segments 1, 7 and 12. Insets show the entire embryo. Scale bar, 100 μm. (A) Seven cuboidal segments have formed. (B) Twelve segments have formed. Segment 1 is cuboidal, segment 7 already has a chevron shape, the most recently formed segment 12 still is cuboidal. (C) Eighteen segments have formed. Segment 12 now is chevron shaped. (D,E) Illustrations of transversal sections of the anterior trunk at the level of segment 7. [Copyright 2000 Wiley. Modified and used with permission from Stickney et al. (Stickney et al., 2000).] (D) At the time of somite formation (segment 7 as representative), the trunk is initially flattened and mediolaterally extended, with the notochord (nc) in the middle. (E) Later, when the segment has completed the rapid morphogenesis of the chevron, the trunk is dorsoventrally extended. The shaded regions in the middle of the segment indicate the position of the muscle pioneers. (F) Sketch of C. Visible segment boundaries are shown as solid lines and the poorly visible boundaries of the first four segments as dotted lines. One chevron-shaped segment is marked in grey. The notochord (dashed line) intersects the apexes of the chevrons. |

Quantification of changing chevron angles for representative anterior and posterior segments. (A) Measurement of the chevron angle. The green area marks the posterior segment boundary and the dorsal notochord boundary in the maximum projection from a z-stack. The light and dark orange lines mark the measured angles γmin and γmax, respectively. (B) Sketch of a bent segment boundary showing the geometrical relationship between γ and chevron angle α. Measured angles γmin and γmax were transformed into α±Δα [α=90 deg–(γmax+γmin)/2, Δα=(γmax–γmin)/2; see Materials and methods]. For straight boundaries, α is 0; α>0 indicates a bent boundary; a is the distance between the apex of the chevron and the initially straight border. (C–E) Blue: angle measurements for segments 1 (C), 7 (D) and 15 (E) of the embryo shown in Fig. 1 as a function of time. The error bar shows the 68% confidence interval. The thin dotted black line shows α=0, meaning no chevron. Grey shaded intervals indicate lack of data due to autonomous movements of the animal. (C) Segment boundary 1 stays straight (on average α=1±11 deg, shown in orange). (D,E) Segment boundaries 7 and 15 form a chevron. Arrowheads mark segment formation time. The fit with a piecewise linear (described by the three parameters chevron formation start time tstart, end time tend and final chevron angle αend, indicated by thick dotted lines) is shown in orange with the uncertainty of the fit depicted by the transparent orange area. (D) tstart=187±33 min, tend=265±34 min, αend =40±2 deg. (E) tstart=357±21 min, tend=471±24 min, αend=44±2 deg. |
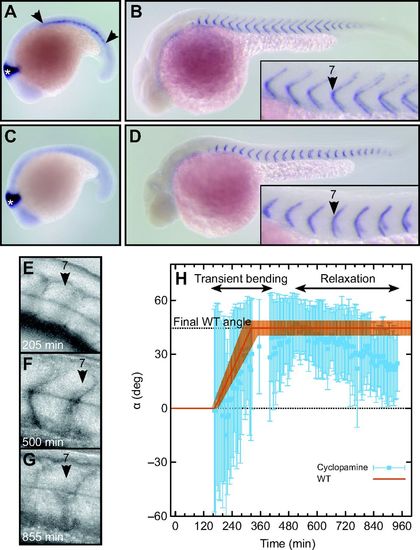
Role of muscle pioneers in chevron maintenance, but not formation. (A,B) Embryos treated with 0.2% DMSO alone (control). (A) engrailed2 (en2) in situ hybridization at 18 somite stage. Muscle pioneers are stained by en2 (area between arrowheads). The midbrain is marked with a white asterisk. (B) cb1045 in situ hybridization at 36 hpf (hours post-fertilization) to visualize segment boundaries. (C,D) Embryos treated with 7.5 μmol l-1 cyclopamine from bud stage. (C) en2 in situ hybridization at 18 somite stage. Muscle pioneers are absent. (D) cb1045 in situ hybridization at 36 hpf. Boundaries are U-shaped. (E–G) Lateral views of segment 7 of an embryo treated with 7.5 μmol l-1 cyclopamine from bud stage. (E) Newly formed segment is cuboidal. (F) At 500 min, the segment has a clear chevron shape. (G) At 855 min, the chevron relaxed into a U-shape. (H) Quantification of chevron angles of the segment shown in E–G (blue squares and error bars). The orange line shows the typical bending of an immobile embryo (piecewise linear function with parameters for segment 7 from Fig. 3, uncertainty depicted by the transparent orange area). WT, wild-type. |
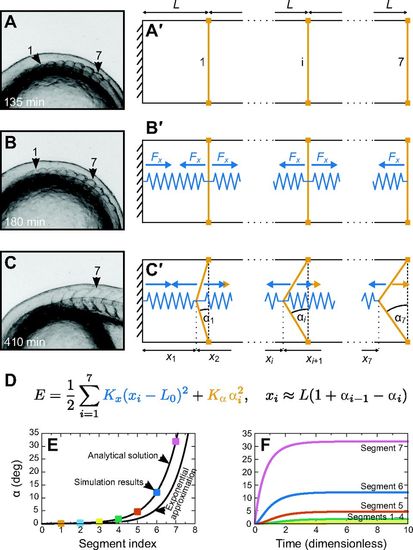
A mechanical model for the establishment of chevron angles. (A–C) Representative segment shapes (see Fig. 1). (A) The first seven segments have formed with a cuboidal shape. (B) At about 180 min, chevron formation starts, hypothetically in accordance with the onset of muscle cell differentiation and concomitant rearrangements in the medial part of the segments that result in a contractile force. (C) At 410 min, segments 1–7 have their final shape. (A′–C′) Construction of a minimal mechanical model for chevron shape establishment. (A′) The model consists of seven segments. The most anterior segment (1), one intermediate segment (i) and the last segment (7) are sketched. The boundary anterior to segment 1 is the posterior boundary of the head and treated as stiff. We neglect the lateral dimension and assume that all segments have the same anteroposterior length L and dorsoventral height h. (B′) To model the hypothesized intra-segmental tension, we insert springs (blue) into each segment. The springs are identical (rest length L0, spring constant Kx). Blue arrows depict the forces exerted on the segment boundaries. (C′) Except for the anterior boundary of segment 1, the segment boundaries are able to bend. The amount of bending is described by chevron angle αi. We assume the dorsal and ventral tips of the boundaries (orange squares) to be fixed by the bulk segment tissue so that the segment length L cannot change and segment boundaries can only react to forces by bending. We assume the segment boundaries resist this bending, which results in forces in opposite direction (orange arrows). (D) This simple mechanical model is fully defined by specifying the energy E of the system. We choose the intra-segmental springs (blue in the equation) to be harmonic and add a penalty for bending of the segment boundaries to the energy (orange in the equation). This penalty depends harmonically on αi and is of strength Kα. The second equation gives the constraints for xi and αi (see Appendix). (E) The final chevron angle in the steady state of our model as a function of segment index. Parameters are K=1, L0=0.1 and seven segments. Black lines show the analytical solution and the exponential approximation as they are derived in the Appendix. The coloured squares are simulation results for the final angle from F. (F) Numerical solutions of the overdamped equations of motion (derived in the Appendix, parameters as before). For the chosen parameter values, the segments simultaneously start to form chevrons at t=0, the time the intrasegmental tension is switched on. Chevron angles increase monotonically for all segments. Segments reach their final chevron angle approximately at dimensionless time t=5. The most anterior segment boundaries 1–3 remain straight and therefore are hard to distinguish in the plot. |