
|
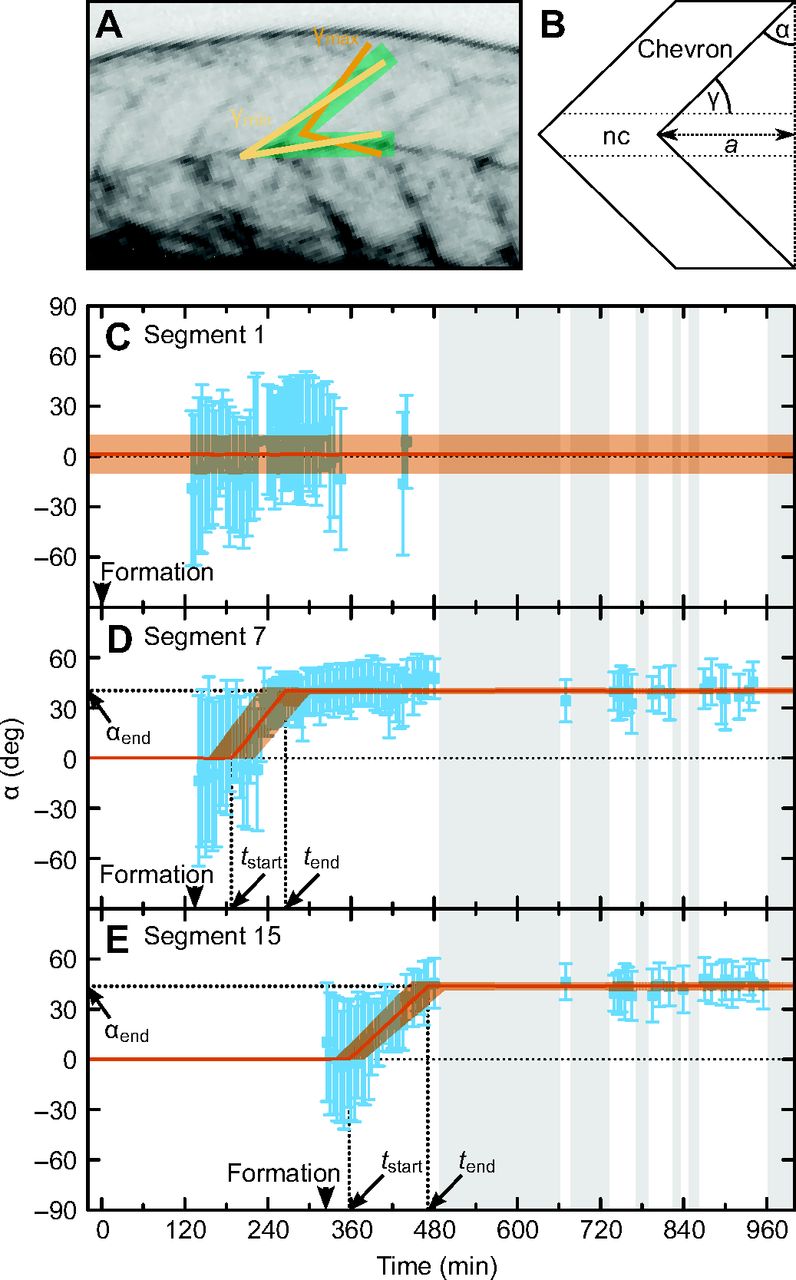
Fig. 2 Quantification of changing chevron angles for representative anterior and posterior segments. (A) Measurement of the chevron angle. The green area marks the posterior segment boundary and the dorsal notochord boundary in the maximum projection from a z-stack. The light and dark orange lines mark the measured angles γmin and γmax, respectively. (B) Sketch of a bent segment boundary showing the geometrical relationship between γ and chevron angle α. Measured angles γmin and γmax were transformed into α±Δα [α=90 deg–(γmax+γmin)/2, Δα=(γmax–γmin)/2; see Materials and methods]. For straight boundaries, α is 0; α>0 indicates a bent boundary; a is the distance between the apex of the chevron and the initially straight border. (C–E) Blue: angle measurements for segments 1 (C), 7 (D) and 15 (E) of the embryo shown in Fig. 1 as a function of time. The error bar shows the 68% confidence interval. The thin dotted black line shows α=0, meaning no chevron. Grey shaded intervals indicate lack of data due to autonomous movements of the animal. (C) Segment boundary 1 stays straight (on average α=1±11 deg, shown in orange). (D,E) Segment boundaries 7 and 15 form a chevron. Arrowheads mark segment formation time. The fit with a piecewise linear (described by the three parameters chevron formation start time tstart, end time tend and final chevron angle αend, indicated by thick dotted lines) is shown in orange with the uncertainty of the fit depicted by the transparent orange area. (D) tstart=187±33 min, tend=265±34 min, αend =40±2 deg. (E) tstart=357±21 min, tend=471±24 min, αend=44±2 deg.