
Fig. 6
- ID
- ZDB-FIG-150313-21
- Publication
- Rost et al., 2014 - Chevron formation of the zebrafish muscle segments
- Other Figures
- All Figure Page
- Back to All Figure Page
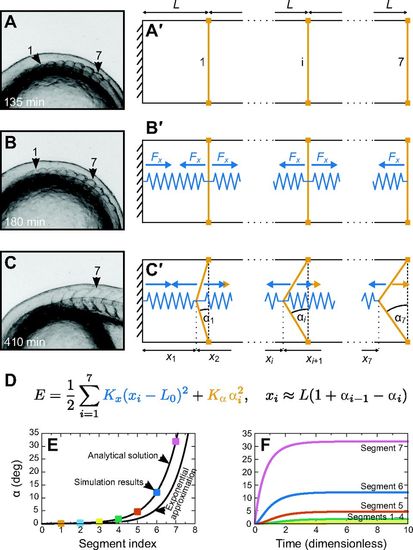
A mechanical model for the establishment of chevron angles. (A–C) Representative segment shapes (see Fig. 1). (A) The first seven segments have formed with a cuboidal shape. (B) At about 180 min, chevron formation starts, hypothetically in accordance with the onset of muscle cell differentiation and concomitant rearrangements in the medial part of the segments that result in a contractile force. (C) At 410 min, segments 1–7 have their final shape. (A′–C′) Construction of a minimal mechanical model for chevron shape establishment. (A′) The model consists of seven segments. The most anterior segment (1), one intermediate segment (i) and the last segment (7) are sketched. The boundary anterior to segment 1 is the posterior boundary of the head and treated as stiff. We neglect the lateral dimension and assume that all segments have the same anteroposterior length L and dorsoventral height h. (B′) To model the hypothesized intra-segmental tension, we insert springs (blue) into each segment. The springs are identical (rest length L0, spring constant Kx). Blue arrows depict the forces exerted on the segment boundaries. (C′) Except for the anterior boundary of segment 1, the segment boundaries are able to bend. The amount of bending is described by chevron angle αi. We assume the dorsal and ventral tips of the boundaries (orange squares) to be fixed by the bulk segment tissue so that the segment length L cannot change and segment boundaries can only react to forces by bending. We assume the segment boundaries resist this bending, which results in forces in opposite direction (orange arrows). (D) This simple mechanical model is fully defined by specifying the energy E of the system. We choose the intra-segmental springs (blue in the equation) to be harmonic and add a penalty for bending of the segment boundaries to the energy (orange in the equation). This penalty depends harmonically on αi and is of strength Kα. The second equation gives the constraints for xi and αi (see Appendix). (E) The final chevron angle in the steady state of our model as a function of segment index. Parameters are K=1, L0=0.1 and seven segments. Black lines show the analytical solution and the exponential approximation as they are derived in the Appendix. The coloured squares are simulation results for the final angle from F. (F) Numerical solutions of the overdamped equations of motion (derived in the Appendix, parameters as before). For the chosen parameter values, the segments simultaneously start to form chevrons at t=0, the time the intrasegmental tension is switched on. Chevron angles increase monotonically for all segments. Segments reach their final chevron angle approximately at dimensionless time t=5. The most anterior segment boundaries 1–3 remain straight and therefore are hard to distinguish in the plot. |