
- Title
-
Rip3 knockdown rescues photoreceptor cell death in blind pde6c zebrafish
- Authors
- Viringipurampeer, I.A., Shan, X., Gregory-Evans, K., Zhang, J.P., Mohammadi, Z., and Gregory-Evans, C.Y.
- Source
- Full text @ Cell Death Differ.
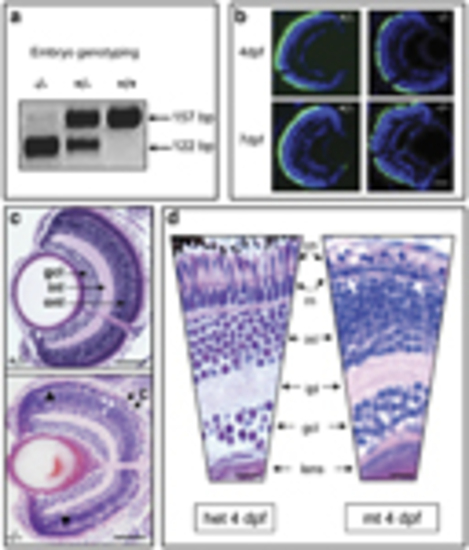
Genotyping and retinal histology for mutant pde6cw59 zebrafish. (a) Genotyping for mutation status using BsaX1 restriction digest of pde6c PCR amplicon. Wild-type (+/+) band is 157bp and the mutant (/) band is 122bp. (b) Heterozygous (+/) and mutant pde6c phenotype on transgenic background of GFP-expressing cone photoreceptors at 4 and 7 days post fertilization (d.p.f.) showing degeneration of cones. Scale bar=20μm. (c) Comparison of sections through heterozygous (+/) and mutant (–/–) retinas at 7>d.p.f. C, degenerating cones (black arrows); gcl, ganglion cell layer; inl, inner nuclear layer; onl, outer nuclear layer; r, single layer of rods (white arrowheads); black arrowheads, preserved peripheral retina. Scale bar=50μm. Dorsal retina is at the top of each panel. (d) Higher magnification of heterozygous (het) versus mutant (mt) retina at 4d.p.f. cn, cone nuclei; ipl, inner plexiform layer; rn, rod nuclei. Scale bar=μm. White arrows: condensed rod nuclei |
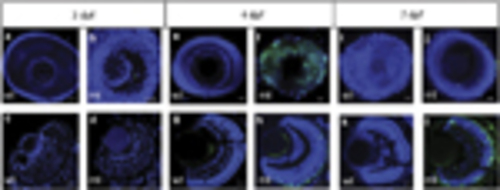
Time course of TUNEL staining in whole-mount and retinal sections. Representative images of whole-mount eyes and corresponding sections at the denoted ages of 3, 4 or 7 days post fertilization (d.p.f.). (a, b, e, f, i, k) Whole-mount eyes. (c, d, g, h, k, l) Retinal sections. mt, pde6cw59/ mutant; wt, wild type. Scale bar is 20μm. TUNEL-positive cells, green labelling; 42,6-Diamidino-2-phenylindole counterstain for cell nuclei |
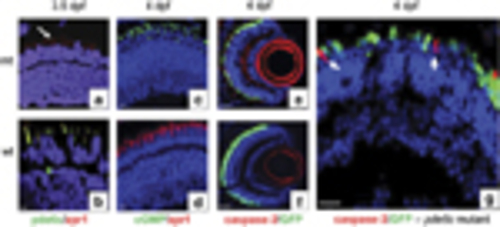
Expression of cell death markers in the retinal sections. (a, c, e, g) Mutant pde6c (mt) retinal images. (b, d, f) Wild-type (wt) retinal images. (a and b) Double immunostaining with zpr1 cone-specific marker in red and pde6c in green. (c and d) Double immunostaining for cGMP labelling in green and zpr1 in red. (e and f) Activated caspase-3 localization in red on GFP-expressing cone transgenic background. (g) Higher magnification of retina in image (e) showing no overlap of caspase-3 red staining in GFP-expressing cones (green). All sections counterstained with DAPI. Scale bar is 5μm, except in e and f, where it is 20μm EXPRESSION / LABELING:
|
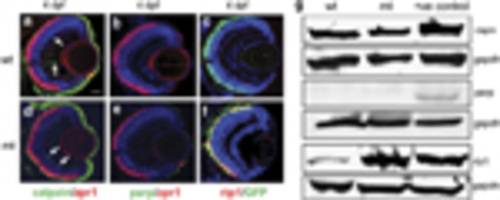
Expression patterns of caspase-independent cell death markers. (a–c) Wild-type (wt) retinal images. (d–f) Mutant pde6c-/- (mt) retinal images. (a and d) Double labelling of calpain in green and zpr1 cone-specific marker in red. A few cells express calpain in the inner retina (white arrows). Scale bar=20μm. (b ande) Double labelling of parp in green and zpr1 in red. (c and f) rip1 co-labelling in red on GFP-expressing cone transgenic background. (g) Western blot of calpain (capn), parp and rip1 at 7d.p.f. Positive (+ve) controls: for parp and capn, mouse E14.5 eye tissue; for rip1, HEK293 cell line. Gapdh used to normalize gel loading EXPRESSION / LABELING:
|

Flow cytometry sorting of fluorescent cone photoreceptors for gene expression analysis. (a and b) FACS plots for transgenic Tg(TαCP:EGFP) embryos that are wild type at the pde6c+/+ locus showing the side scatter (SSC) and EGFP profiles. (c and d) FACS plots for mutant Tg(TαCP:EGFP)-pde6cw59/ cone photoreceptors. (e) Quantification of real-time RT-PCR expression data for rip1 and rip3 from EGFP-positive cells at 4 and 7d.p.f. in photoreceptors from wild-type (wt) and mutant (mt) embryos. Data presented as mean±S.E.M. *P<0.05, n=9. (f) Relative RT-PCR analysis for rod photoreceptor genes (pde6a, pde6c, rho), cone pde6h gamma subunit and β-actin internal control from whole adult retinal RNA (lanes 1 and 6); FACS-sorted mutant cone RNA (lanes 2 and 4); FACS-sorted wild-type cone RNA (lanes 3 and 5). RT, reverse transcriptase |
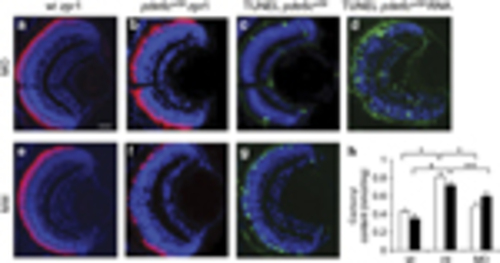
Phenotype at 4d.p.f. after morpholino knockdown of rip3 in wild-type (wt) and pde6cw59 mutant (mt) embryos. (a–d) rip3 morpholino (MO) injection. (e–g) rip3 mismatch morpholino (MM) injection. (a and e) Control injections of MO or MM in wt embryos. Zpr1 cone-specific labelling in red. Scale bar=μm. (b) rip3 MO knockdown in mt embryos showing increased zpr1 labelling in red. (c) TUNEL labelling in rip3 MO knockdown mt embryos. (d) TUNEL labelling in mt embryos co-injected with rip3 MO and rip3 RNA. (f) rip3 MM knockdown in mt embryos showing decreased zpr1 labelling in red. (g) TUNEL labelling in mt embryos injected with rip3 MM. (h) ELISA quantitation of carbonyl content in wt, mt and MO-injected embryos at 4d.p.f. (white bars) or 7d.p.f. (black bars). Mean±S.E.M., n=8, *P<0.0001; **P<0.001 |
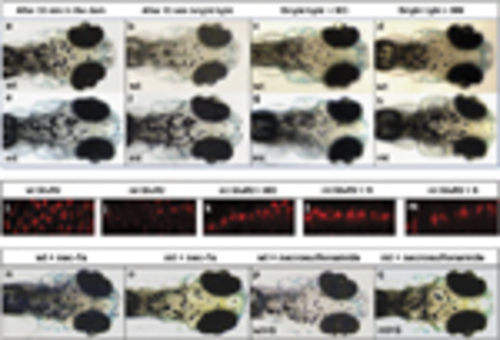
Visual background adaptation (VBA) in response to bright light stimulation at 7d.p.f. Upper panels, wild-type (wt) embryos; lower panels, pde6cw59 mutant (mt) embryos. Representative images showing the distribution of melanin after dark adaptation (a and e); after light adaptation (b and f); after rip3 morpholino (MO) injection (c and g); after mismatch control morpholino (MM) injection (d and h). (a and b) Images taken from the same wild-type larva before and after light adaptation. (e and f) Taken in the same mutant larva before and after light adaptation. (i) Labelling of GluR2 receptors in wt retina (i); mt retina (j); in rip3 morphant retina (k); in retina treated with necrostatin-1s (l); in retina treated with necrosulfonamide (m). VBA response in wt (n) or mt larvae (o) treated with necrostatin-1s (N) showing small pigment granules. VBA response in wt (p) or mt larvae (q) treated with necrosulfonamide (S) showing small pigment granules PHENOTYPE:
|
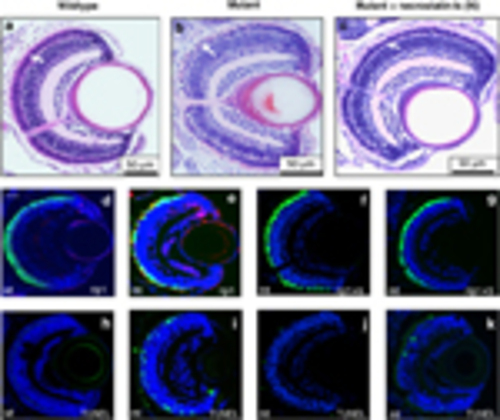
Effect of RIP signalling inhibitors on pde6cw59 mutant phenotype at 7 d.p.f. Retinal histology in (a) wild-type (wt), (b) untreated mutant (mt) and (c) mt retina from embryos treated with 100mM necrostatin-1s (N). White arrows in a–c indicate the photoreceptor nuclear layer of the retina. Rip1 labelling (red) in wt retina (d), in mt retina co-localizing with EGFP-expressing cones that are dying (e), and in mt retina treated with necrostatin-1s (f). (g) rip1 labelling in the retina of pde6cw59 mutant embryos treated with 20μM necrosulfonamide (S). TUNEL labelling in non-transgenic pde6cw59 mutant embryos (h–k) corresponding to the treatment panels (d–g) above. Scale bar in d=20μm |

Spatiotemporal expression of rip1, cGMP and tnfα in wildtype (Wt) and pde6cw59 (Mt) retina. Rip1 (red) expression is on the cone-GFP (green) transgenic background. Tnfα (green) co-localization with cone-specific zpr1 (red) staining. DAPI staining in blue. |