
|
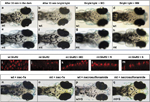
Fig. 7
Visual background adaptation (VBA) in response to bright light stimulation at 7d.p.f. Upper panels, wild-type (wt) embryos; lower panels, pde6cw59 mutant (mt) embryos. Representative images showing the distribution of melanin after dark adaptation (a and e); after light adaptation (b and f); after rip3 morpholino (MO) injection (c and g); after mismatch control morpholino (MM) injection (d and h). (a and b) Images taken from the same wild-type larva before and after light adaptation. (e and f) Taken in the same mutant larva before and after light adaptation. (i) Labelling of GluR2 receptors in wt retina (i); mt retina (j); in rip3 morphant retina (k); in retina treated with necrostatin-1s (l); in retina treated with necrosulfonamide (m). VBA response in wt (n) or mt larvae (o) treated with necrostatin-1s (N) showing small pigment granules. VBA response in wt (p) or mt larvae (q) treated with necrosulfonamide (S) showing small pigment granules