
- Title
-
Quantitative analysis of cell migration using optical flow
- Authors
- Boric, K., Orio, P., Viéville, T., and Whitlock, K.
- Source
- Full text @ PLoS One
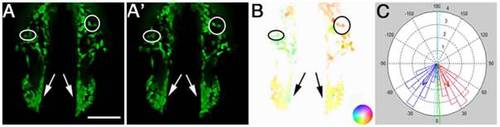
Optical Flow analyses of net cell movement. (A, A′) Two consecutive frames of a time-lapse movie. B) Optical Flow analysis yields a vector field that is represented in a color-coded manner. As shown in the inset, color hue represents direction of movement and color intensity represents magnitude of movement. C) Polar histogram showing the distribution of the summed angles of motion vectors detected by OF. Blue and red bars depict binned movement in the left and right side of the field, respectively. Red and blue arrows represent the average vector of movement, and the green arrow is the average vector over the whole field. Scale Bar = 50 µm. Anterior movements are toward the bottom of the page. |
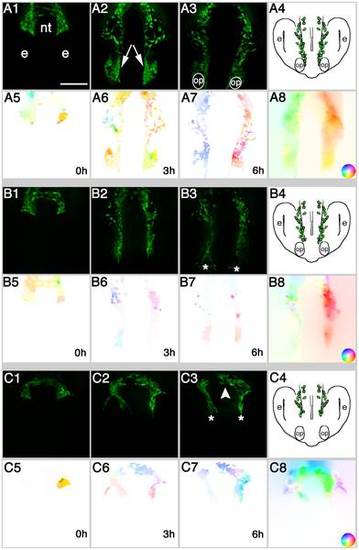
Analysis of cell migration at the population level reveals EtOH induced differences in CNCC migration patterns. Representative examples of A) Control, embryos treated in B) 100 mM and C) 200 mM EtOH. 1–3) Video frames captured from time-lapse movies at beginning (0 h) middle (3 h) and end (6 h) of the recording period. 4) Cartoon of a 20–22 somite embryo, showing location of CNCC (green) at the end of migration. 5–7) Color-coded image showing the movement vectors detected by OF analysis. 8) Movement vectors summed for the complete six-hour sequence. The inset is the color scale representing direction and magnitude of movement. Color intensity represents movement magnitude and a given color hue represents the movement’s direction. Dorso-Frontal views: posterior to the top. Scale Bar = 50 µm. nt = neural tube, e = developing eye, op = olfactory placode. Anterior movements are toward the bottom of the page. |
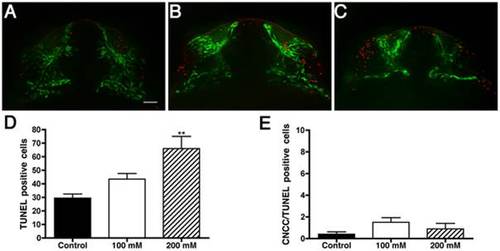
Ethanol increases non-specific cell death. Fluorescent images showing cell death (red) and CNCC (green) in A) Control, B) 100 mM EtOH and C) 200 mM EtOH treated sox10:EGFP 24 hpf embryos. D) Variance analysis reveals a significant increase in the number TUNEL positive cells (p<0.0007; n = 10 per treatment) throughout the craniofacial area. E) The number of CNCC positive for both EGFP and TUNEL are: control = 0.4 cells, 100 mM = 1.5 cells, and 200 mM = 0.9 cells. Error bars = SEM. Frontal views: dorsal to the top. Scale bar = 20 µm. |